PV data consultancy Wiki-Solar says the world’s top solar developers have added nearly 50 GW of new solar capacity since early 2023, raising their cumulative capacity to 146.7 GW – more than one-fifth of the global total.

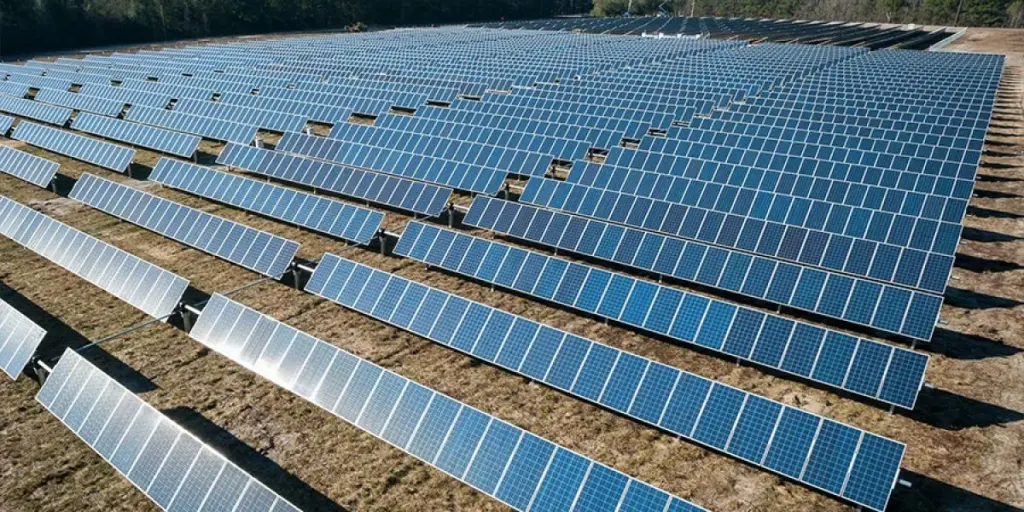
Image: American Public Power Association, Unsplash
The world’s top 27 utility-scale PV developers installed 48.6 GW of new solar capacity between the start of 2023 and the third quarter of 2024, according to analysis from Wiki-Solar.
The figure covers 451 new utility-scale (above 4 MW) projects throughout the world, representing nearly 50% growth over the 100 GW these developers held at the end of 2022.
Wiki-Solar’s ranking shows that the top 27 utility-scale solar developers hold a cumulative capacity of 146.7 GW – about 21% of global capacity – spread across 2,738 operating plants.
US-based NextEra Energy currently tops the list, having expanded its capacity by 74% since 2022, largely through new projects commissioned by its subsidiary, Florida Power & Light. Its total capacity has reached 14.6 GW.
China’s State Power Investment Corp. (SPIC) ranks second, with a cumulative 11.6 GW. China currently holds more utility-scale solar capacity than the next six countries combined, according to Wiki-Solar.
Italy’s Enel ranks third with 8.2 GW of solar capacity. Asian developers are climbing the list, with India’s Adani Green Energy and Tata Power in fourth and seventh place, respectively. Saudi Arabia’s ACWA Power joins the top 10 for the first time, taking the ninth position.
Wiki-Solar founder Philip Wolfe said the database gives insight into how geography impacts average project size.
“ACWA is developing mega-projects in Saudi Arabia and elsewhere with average capacity over 330 MW,” Wolfe said. “For Chinese and Indian companies 100 MW is typical, whereas an average of 20 to 30 MW is not uncommon for European developers.”
Wiki-Solar also collects data on the largest plant owners and independent power producers (IPPs). The top 28 plant owners and IPPs account for 135 GW of solar capacity, equivalent to 19% of the world’s total.
The database shows that some developers sell their projects once they are operational, while others buy projects, allowing them to move higher up the rankings. SPIC tops the list of plant owners, with a cumulative capacity of 15 GW, followed by NextEra Energy with 10.8 GW and France’s Engie with 7.9 GW.
This content is protected by copyright and may not be reused. If you want to cooperate with us and would like to reuse some of our content, please contact: editors@pv-magazine.com.
Source from pv magazine
Disclaimer: The information set forth above is provided by pv-magazine.com independently of Alibaba.com. Alibaba.com makes no representation and warranties as to the quality and reliability of the seller and products. Alibaba.com expressly disclaims any liability for breaches pertaining to the copyright of content.


