Sales teams today use centralized cloud software to handle various tasks, such as CRMs, email marketing, and integration tools, making sales data easy to access. Top global brands use this sales data in smart ways to improve their business decisions, but any company can use insights and reporting tools to succeed with data-driven sales.
Yet, sorting through numerous sales metrics can be daunting, and knowing how to use this information effectively is another challenge. This article will show businesses how to use data-driven sales to meet their company’s unique goals and needs.
Table of Contents
Sales data: what is it and why is it important?
How businesses can perform sales analysis in 4 steps
Key metrics and KPIs to analyze in sales data
Rounding up
Sales data: what is it and why is it important?

Sales data includes many measurements, but if retailers can track it in the sales process, they can call it sales data. Modern tools like cloud-based CRM systems can help businesses gather this data. However, they must know how to interpret it to see what it means for their business and where they can improve.
Because sales data covers so much, businesses may not know what to focus on, especially when they also need to spend time selling. Should brands track the average time deals spend in your pipeline or the engagement rate of their email campaigns? Would analyzing their meeting success rates or average deal size allow them to make better sales forecasts?

With the right sales analysis tools, businesses can access a lot of information and identify trends that help their team improve and set better sales goals for the company. The key is knowing which metrics to focus on and when to use them.
How businesses can perform sales analysis in 4 steps
Step 1: Select the sales analysis methods

Different sales analysis methods produce varying reports, so businesses must pick one that aligns with their sales goals. Here are seven key sales analysis reports to consider:
- Sales trend analysis: This analysis tracks patterns in sales data to monitor the team’s progress and understand trends in products, customers, and locations.
- Sales performance analysis: Businesses need this analysis to evaluate their sales team’s effectiveness by comparing actual results to expected outcomes. They can use its report to improve closing times, win rates, and revenue growth.
- Predictive sales analysis: This analysis helps forecast future risks and opportunities, allowing retailers to create accurate sales predictions.
- Sales pipeline analysis: This analysis identifies common activities prospects do before converting. It helps business teams shorten sales cycles and close more deals.
- Product sales analysis: This analysis is useful for large companies or those with many products. It shows which products impact their bottom line, helping these businesses understand customer preferences and popular items.
- Prescriptive analytics: It gives sales reps insights into which opportunities to pursue or drop, boosting their success and overall win rates.
- Market research: Though traditional, this method remains effective. Survey customers, research competitors, and review sales statistics to understand customer needs and enhance sales strategies.
Step 2: Know the information to target

Once a business has picked the right way to look at sales—and it fits its goals—there’s still more to do. Next, the business must figure out what specific details it needs to analyze. Maybe it wants to see the sales training’s effectiveness or track which product sold the most during a recent ad campaign. It may also want to look for patterns among customers who are repeat buyers.

Once the business identifies the key information it needs, it can choose the right numbers and key points to help get and measure it (more on these metrics in the next section). But before that, what about timing? How often should the business collect data? This question depends on what it’s tracking, but it’s common to look at weekly, monthly, quarterly, and yearly data. Just remember, staying consistent is key, no matter which numbers to watch. Also, plan to check more often during special sales or promotions.
Step 3: Analyze sales data with the right sales analysis tool

With so much information on leads, deals, and communications to manage, businesses will need efficient software that provides easy access to every metric they want to track. The three options include spreadsheets, CRM platforms, and sales analytics apps. Here’s a closer look at each option:
Spreadsheets
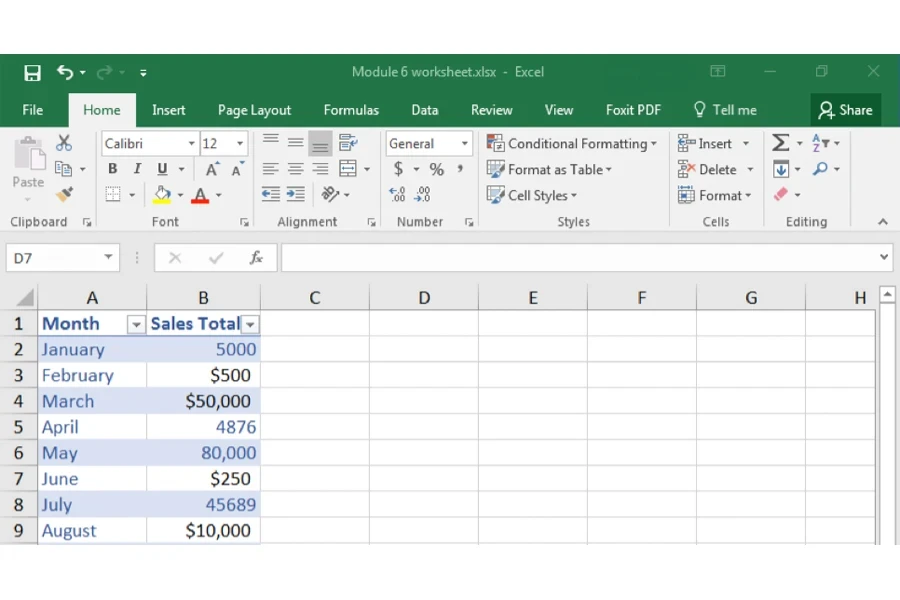
Using spreadsheets to gather data has several benefits. For starters, they are free (like Google Sheets and Open Office) and give a real-time view of current sales operations. Businesses can also set them up to automatically calculate the added data.
However, the drawback is that retailers must enter all data manually. If businesses want their team to spend less time on data entry and more time focusing on their best leads, consider switching to a CRM with automated data collection.
Pro tip: Businesses can use report templates to make their spreadsheet experience easier.
CRM
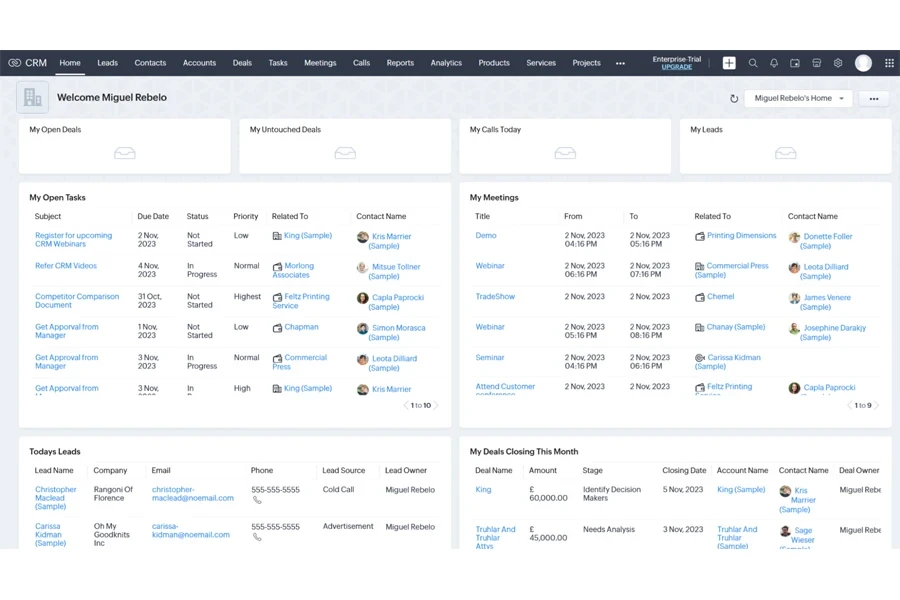
Customer relationship management (CRM) software is much better than spreadsheets in many ways. CRMs record interactions with leads automatically, saving the user’s team time and ensuring businesses never miss any communication. With mobile apps and third-party integrations, CRMs allow companies to track more data.
CRMs can show businesses if their email campaigns were successful, how long effective cold calls lasted, and where their best leads come from. They also provide reports on sales patterns so businesses can repeat and improve them. Some good options include Close, HubSpot, Pipedrive, Zendesk, and Apptivo.
Sales analytics apps
Businesses can also find tools that specifically handle sales analysis. For instance, Chorus.ai helps users review sales calls to find ways to improve. Gong.io helps companies track customer interactions and predict future sales. Lastly, Seismic can help measure the effectiveness of sales strategies.
Step 4: Show sales data analysis to relevant people

Finally, teams need to share their sales data with important people. Unless these people ask for details on how businesses got their results, they only need to show the key points. Hence, they can use graphs and visuals to make the data easier to understand. They may also use a revenue growth calculator to help make complex sales data clearer.

For instance, if retailers lead a sales team and need to update investors and stakeholders, they can include charts showing sales goals, top-selling products, and their team’s revenue and expenses. These sales presentations should be clear and provide useful insights. Remember to conclude with recommendations to help achieve the goals of the analysis.
Key metrics and KPIs to analyze in sales data
Now that businesses understand how to do a thorough sales analysis using the four steps mentioned earlier, it’s time to pick a few key indicators to track. As stated in step two above, businesses can use what they need for their sales to understand the numbers and metrics they must track. Here are 10 metrics they will likely track at some stage of their business.
Monthly sales growth
This metric shows whether the sales revenue is increasing, decreasing, or staying the same. It helps businesses improve their sales processes.
How to calculate: (Current month’s sales − Previous month’s sales) / Previous month’s sales × 100
Sales opportunities
This metric indicates how many opportunities the retailer’s sales team creates, helping them identify good and bad prospects.
How to calculate: Count the total number of opportunities created in a given period (e.g., month, quarter, or year).
Lead conversion rate
Businesses need this metric to see how many leads turn into opportunities, helping them refine their customer acquisition strategy.
How to calculate: (Number of leads converted into opportunities) / (Total number of leads) × 100

Average conversion time
Businesses can use this metric to measure how long it takes for leads to become paying customers, providing insight into their sales efficiency.
How to calculate: (Total time for all lead conversions) / (Number of conversions)
Demo calls booked and monthly onboarding
With this metric, a business can track the number of prospects reaching the demo or onboarding stage, indicating the health of the retailer’s sales funnel.
How to calculate: Count the number of onboarding and demo calls booked in a given period.
Pipeline value
This metric estimates the revenue from current sales opportunities within a specific time frame.
How to calculate: (Value of projected sale) × (Probability of closing)
Sales targets
This metric tracks historical team performance, showing revenue generated or product subscriptions sold.
Customer lifetime value (CLV)
Retailers can use this metric to predict how much revenue the average customer will generate over their lifetime, helping with future planning.
How to calculate: (Average revenue per customer) × (Average customer lifespan)
Calls and emails per rep
This KPI tracks the number of calls and emails made by each sales rep, helping to evaluate productivity and identify issues.
How to calculate: Total number of calls or emails made by the team in a specific period.
New and expansion monthly recurring revenue (MRR)
These metrics are crucial for SaaS companies to compare monthly revenue and assess sales and marketing effectiveness.
How to calculate New MRR: (Number of new customers) × (MRR per new customer)
How to calculate Expansion MRR: [(Expansion MRR at month-end − Expansion MRR at month-start) / Expansion MRR at month-start] × 100
Rounding up
Sales analysis reports are crucial because they keep everyone accountable, show valuable insights about customers, and highlight the qualities of the retailer’s sales reps. They can truly transform a business’s sales strategies and decision-making processes, making them worthy of their full attention and dedication.
As mentioned in this article, CRM tools are necessary for sales data analysis. Hence, some top options businesses can use include Zoho Corporation, Looker, Pipedrive, HubSpot, Zendesk, and Freshsales.