Solar, wind and natural gas made up more than 91% of the capacity added to the US electric grid in 2021, according to the Electric Generator Construction Costs and Annual Electric Generator Report by the EIA.
While total construction cost for solar approached $20 billion, average construction costs for solar systems fell in the United States in 2021, compared to 2020. The EIA figures show that in 2021, solar construction costs fell 6% from 2020, dropping to $1,561/kW. The decrease was driven primarily by a 10% drop in the construction cost for crystalline silicon tracking panels, which fell to $1,423/kW – their lowest average cost since 2014.
The EIA figures show that solar construction costs fell 6% in 2021 over 2020, dropping to $1,561/kW. The decrease was driven primarily by a 10% drop in the construction cost for crystalline silicon tracking panels, which fell to $1,423/kW, their lowest average cost since 2014.
The report notes that the average construction cost for crystalline silicon fixed-tilt panels increased by 5% to $2,047/kW. The average cost for cadmium telluride panels remained relatively stable, decreasing only 1% to $1,626/kW in 2021. Fixed-tilt tracking systems automatically move to follow the sun as it moves across the sky. While they are the highest cost, they produce more electricity by continuously following the sun.
It’s worth noting that this follows a time when solar module prices had doubled primarily due to supply shortages during the pandemic. In response to the shortage, many manufacturers increased production while developers stockpiled supply.
Since the pandemic began in 2020, module prices have continued to fall, hitting a global two-year low in April 2023. In the first two months of 2023, average US module prices were $0.36/W (DC), down 11% quarter over quarter. Modules traded at a 57% premium over the global spot price for monofacial monocrystalline silicon modules.
Taking a regional view, the greatest growth in solar addition happened in the southern part of the United States, with Texas leading the way. In 2021, Texas added 100 new plants for a total of 10,155 MW compared to just 2,347 added in Ohio.
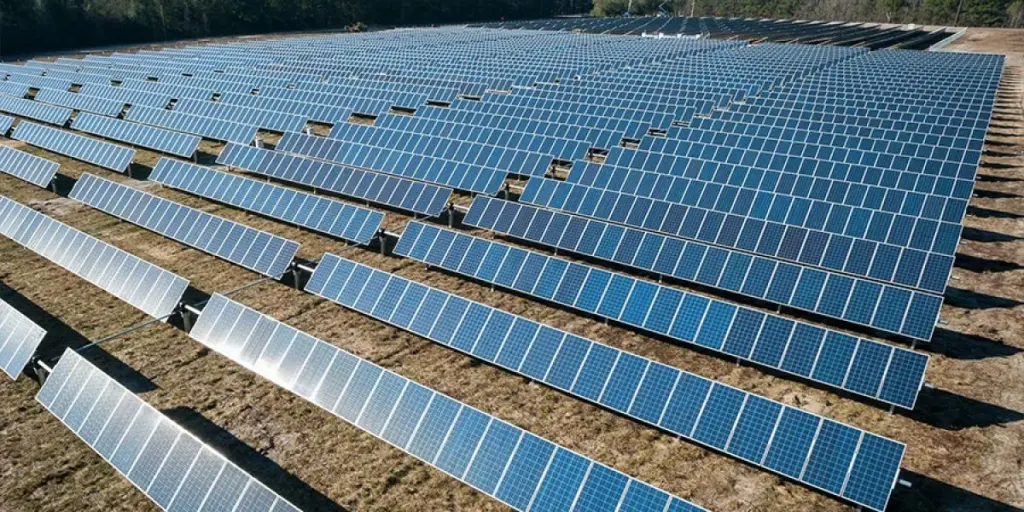
While Texas still leads the nation in solar installations, the numbers look vastly different than two years ago. For example, a 36 GW buildout is expected by the Solar Energy Industries Association (SEIA) over the next five years, building on the roughly 16 GW that is active to date. Much of today’s investment in solar, which nears $20 billion, is going toward large solar facilities, often exceeding 100 MW in capacity.
Source from pv magazine
Disclaimer: The information set forth above is provided by pv magazine independently of Alibaba.com. Alibaba.com makes no representation and warranties as to the quality and reliability of the seller and products.