The US Federal Energy Regulatory Commission’s (FERC) project pipeline data shows that solar could feasibly push out natural gas as the No. 1 electricity source by 2030.
FERC’s new energy infrastructure report shows that solar holds the largest share of capacity additions in the energy mix in the United States.
In the January-August period, just under 9 GW of solar capacity was added, representing 40.5% of all capacity additions. This represents 36% growth year on year.
Wind power provided an additional 2.7 GW, accounting for about 12.5% of new capacity additions. When including solar, wind, hydropower, geothermal, and biomass, renewable energy sources contributed 54.3% of capacity additions.
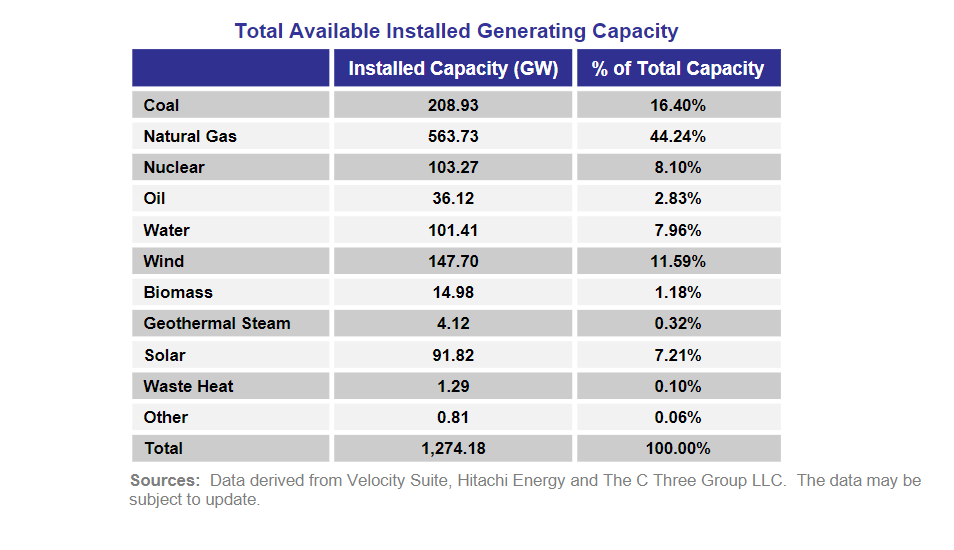
Much growth lies ahead for decarbonized energy to push out fossil fuel sources. For total available installed generating capacity, natural gas remains the leader. More than 44% of available electricity generation capacity comes from natural gas, followed by coal, wind, hydropower, and solar.
FERC forecasts strong growth in solar for years to come. It expects more than 83 GW of “high probability” solar capacity additions through August 2026. This dwarfs the 4 GW of natural gas additions expected through that date.
FERC said that the 83 GW of “high probability” solar additions may be quite conservative. There are more than 214 GW of solar additions in the three-year project pipeline.
Natural gas has 564 GW available installed capacity today, while solar has 92 GW. Looking ahead three years, if solar were to add all the projects in the pipeline to the grid, it would reach 306 GW. The figures suggest that with a healthy ramp-up of projects, solar could feasibly push out natural gas as the No. 1 provider of electricity by 2030.
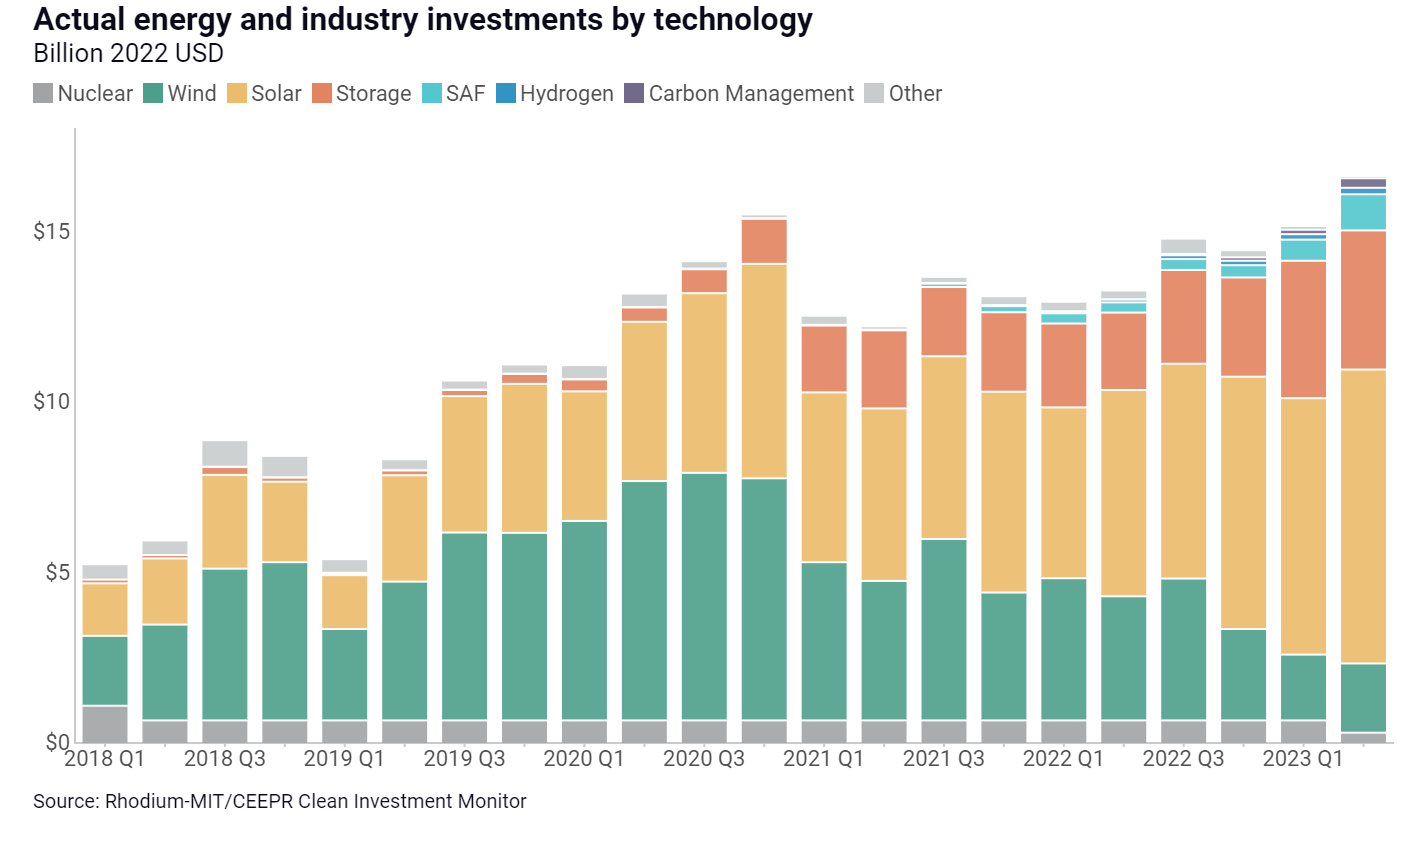
Reaching status as the number one provider of electricity will take significant funding. A report from Rhodium Group and the Massachusetts Institute of Technology (MIT) showed that the United States’ total investment in clean energy, clean transportation, building electrification and carbon management reached $213 billion over the last year (from July 1, 2022 to June 30, 2023).
The $213 billion invested represents a 37% leap over 2021-22 investments of $155 billion. Clean investment continues to strongly increase each year. In 2018/2019, total investments reached $81 billion, and it has climbed every year since.
Domestic manufacturing of clean energy technologies has become an increased focus in recent years, and rich tax credits and incentives have served as an attracting force. Manufacturing investments totaled $39 billion in 2022/2023, more than doubling the $17 billion invested in the previous report period.
Solar represented the largest energy and industry investment category in the second quarter of 2023, attracting $8.62 billion. This was followed by storage with $4.08 billion, and wind with $2.03 billion.
This content is protected by copyright and may not be reused. If you want to cooperate with us and would like to reuse some of our content, please contact: editors@pv-magazine.com.
Source from pv magazine
Disclaimer: The information set forth above is provided by pv-magazine.com independently of Alibaba.com. Alibaba.com makes no representation and warranties as to the quality and reliability of the seller and products.