
If there’s one issue that online retailers constantly struggle with, it’s cart abandonment.
While it is certainly true that cart abandonment is unavoidable for ecommerce stores, there are ways to reduce it.
Knowing why shoppers abandon carts can help you remove potential barriers before they turn potential shoppers away. And you can use automated cart abandonment emails to turn abandoned carts into additional revenue.
This guide explores the latest cart abandonment stats for 2024, as well as proven incentives to reduce cart abandonment, re-engage prospects, and boost conversions.
Current statistics of cart abandonment
Before we discuss recent cart abandonment stats, let’s set the stage.
According to Contentsquare, brands experienced a challenging landscape in 2023.
They experienced the following:
- A rise in ad spending coupled with a notable decrease in overall traffic led to a 9.4% increase in the cost per visit, compared to 2022.
- A 3.9% rise in user frustration, leading to a decline in engagement.
- A 5.5% drop in conversion rates.
Now, let’s look at the statistics for cart abandonment. According to Statista and the Baymard Institute:
- The average online shopping cart abandonment rate worldwide reached 70.19% in 2023. This was the first time since 2013 that it crossed the 70% mark.
- This trend represents a steady increase from 68.07% in 2014 to 69.99% in 2022, as shown in the chart below.

Interestingly, Dynamic Yield benchmarks, as of February 2024, closely resemble Statista’s findings:
- A 73.12% cart abandonment rate, signifying many unrealized potential sales.
- A global add-to-cart rate of around 7.6%. This indicates the proportion of visitors who start the purchasing process.
Similarly, Monetate’s Q4 2023 data indicate:
- An add-to-cart rate of 11.9% suggests a high level of interest and intent among shoppers.
- An abandoned cart rate of 79.3%, indicates a substantial gap between intent and completion of purchases.
These numbers underline the urgency of addressing cart abandonment issues.
With such high abandonment rates, businesses are losing significant potential sales and revenue. However, the high add-to-cart rates also present an opportunity to recover many abandoned carts.
Cart abandonment rates by industry
Industries experience varying degrees of shopper retention. Let’s examine the shopping cart abandonment rate across sectors and its implications for online retailers.
Monetate’s Q4 2023 data provides industry insights into these cart abandonment stats:
- The Electronics industry had an 88.6% shopping cart abandonment rate. In short, nearly 9 out of 10 shoppers abandoned their carts when purchasing electronics online.
- The Apparel & Accessories industry abandonment rate stood at 80.3%.
- The Health & Beauty industry had a 78.4% cart abandonment rate.
- Luxury recorded a 78.2% abandonment rate.
- Outdoor & Sporting Goods saw a 77.1% shopping cart abandonment rate.
- B2B follows closely behind at 72.2%.
- Specialty Products fared relatively better, with a 64.7% abandonment rate.
There is also a similar pattern in Dynamic Yield’s benchmark for February 2024.
- At 79.94%, Home & Furniture had the highest shopping cart abandonment rate.
- This sector consistently had the highest abandonment rates over the last 12 months, at 80.03%. Meanwhile, Pet Care & Veterinary Services had the lowest at 59.16%.
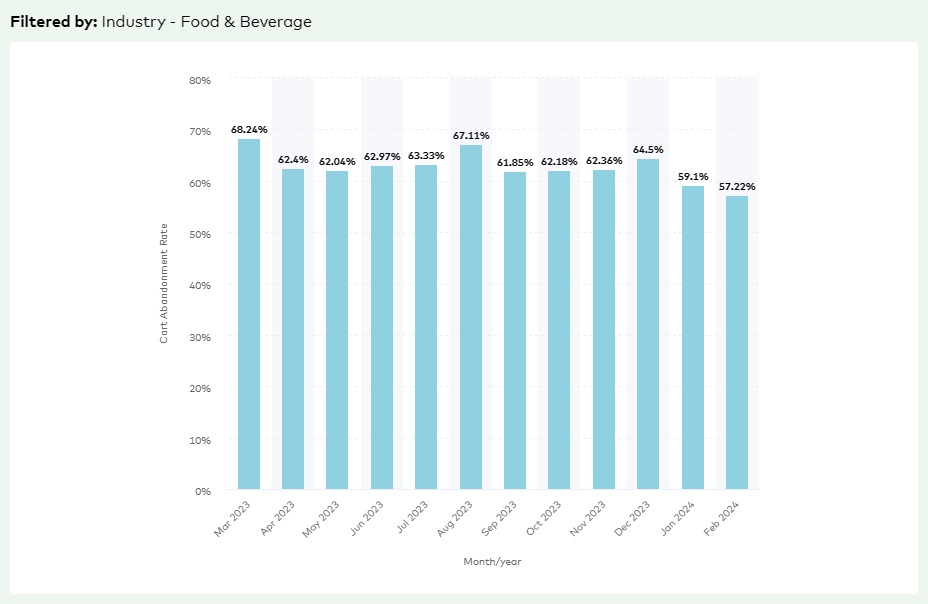
- The Consumer Goods industry had a cart abandonment rate of 64.11%. Meanwhile, the Food and Beverages industry, shown in the chart below, had the second-lowest cart abandonment rate of 57.22% in February, and fluctuations over the year.
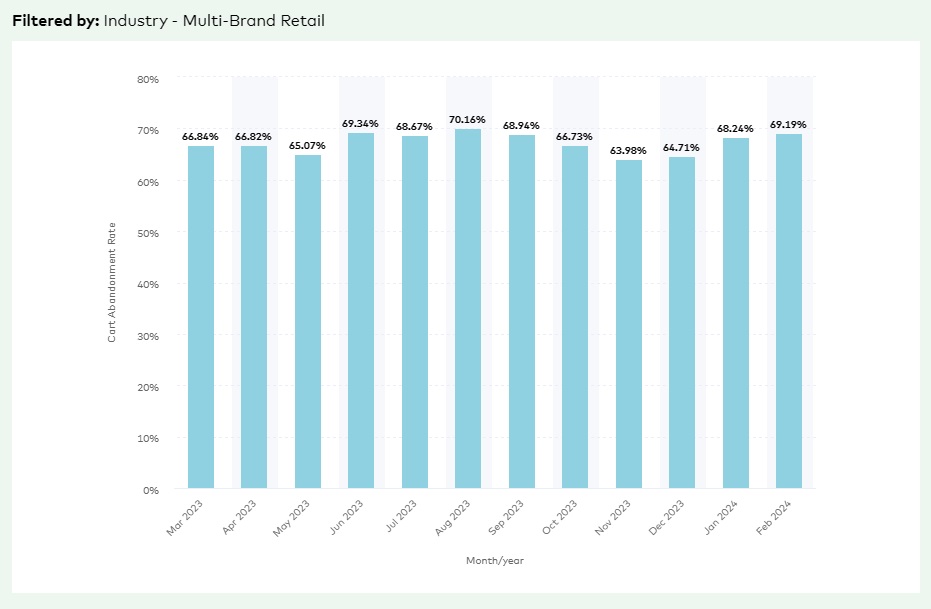
- Lastly, the Multi-Brand Retail industry had a 69.19% cart abandonment rate in February 2024. The chart below shows the trend over a year.
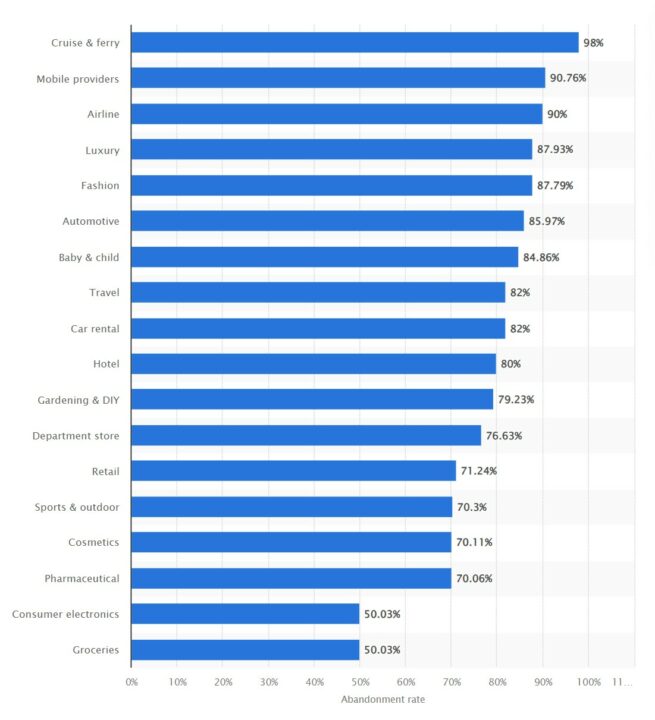
Looking back to 2022 for historical context, Statista’s data reveal the following:
- The Cruise and Ferry industry had the highest cart abandonment rate at a jaw-dropping 98%. Nearly every shopper abandoned their cart when booking these travel services online.
- Conversely, the Grocery and Consumer Electronics industries had the lowest abandonment rates, at 50.03%.
The chart below illustrates how various industries fared in cart abandonment rates in 2022:
Related:
- Abandoned cart tracking: Learn how Omnisend tracks contacts leaving their carts behind
- How to lower your cart abandonment rate with Google Analytics
- Cart abandonment incentives: How to make them effective
Cart abandonment rates by device type
The device used when shopping online can significantly impact cart abandonment rates.
According to Monetate’s Q4 2023 findings:
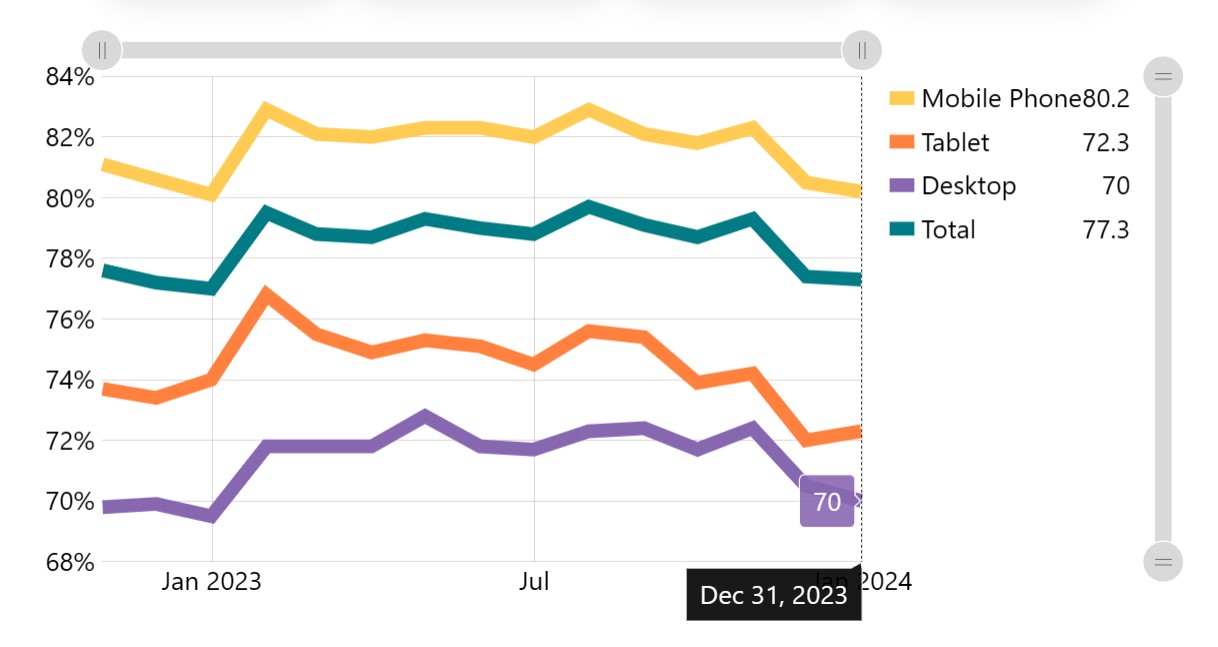
- Mobile phones lead the pack with an abandonment rate of 80.2%. This is notably higher than the rates for tablets (72.3%) and desktops (70%).
Dynamic Yield’s 2024 findings paint a similar picture:
- Mobile devices have the highest shopping cart abandonment rate, at 76.38%.
- Tablets and desktops follow with abandonment rates of 67.79% and 65.27%, respectively.
There are several factors that may account for higher cart abandonment rates on mobile devices:
- Less optimized mobile experience.
- Smaller screen sizes can hinder usability and navigation.
- Slower page load times on mobile networks.
- Increased distractions and multitasking on mobile devices.
In fact, Statista’s Q2 2022 data found that ecommerce site conversion rates were consistently lower on mobile devices than on desktop computers:
- Desktops had the highest conversion rates across regions. Great Britain (5%), the US (3%), Europe, the Middle East, and Africa [EMEA] (2%), and others (2%).
- Tablets followed closely behind. Conversion rates range from Great Britain (4%) and the US (3%) to EMEA (1%) and others (1%).
- Mobile phones had the lowest conversion rates. Great Britain (4%) and the US (2%) to EMEA (1%) and others (1%).
To combat device-specific cart abandonment rates, businesses must prioritize tailored optimization strategies.
Mobile:
- Implement a mobile-friendly, responsive design.
- Streamline the checkout process for smaller screens.
- Optimize for fast-loading pages.
- Consider mobile wallets or one-click checkout options.
Tablets:
- Leverage the larger screen sizes for seamless shopping experiences.
- Use high-resolution images and a responsive design.
- Optimize for tablet-specific interaction patterns such as stylus support and split views.
Desktops:
- Ensure clear navigation and a straightforward checkout.
- Provide easy access to support and product information.
- Optimize desktop-specific features like detailed product comparisons and persistent shopping carts, so items remain in the cart even if the session expires or the browser is closed.
Ecommerce businesses need to understand each device type’s unique challenges and customer behaviors. This can help reduce cart abandonment rates and recover previously lost revenue opportunities across all platforms.
Cart abandonment rates by common reasons
Understanding the common reasons for cart abandonment can help you address consumer pain points. They can also improve conversion rates.
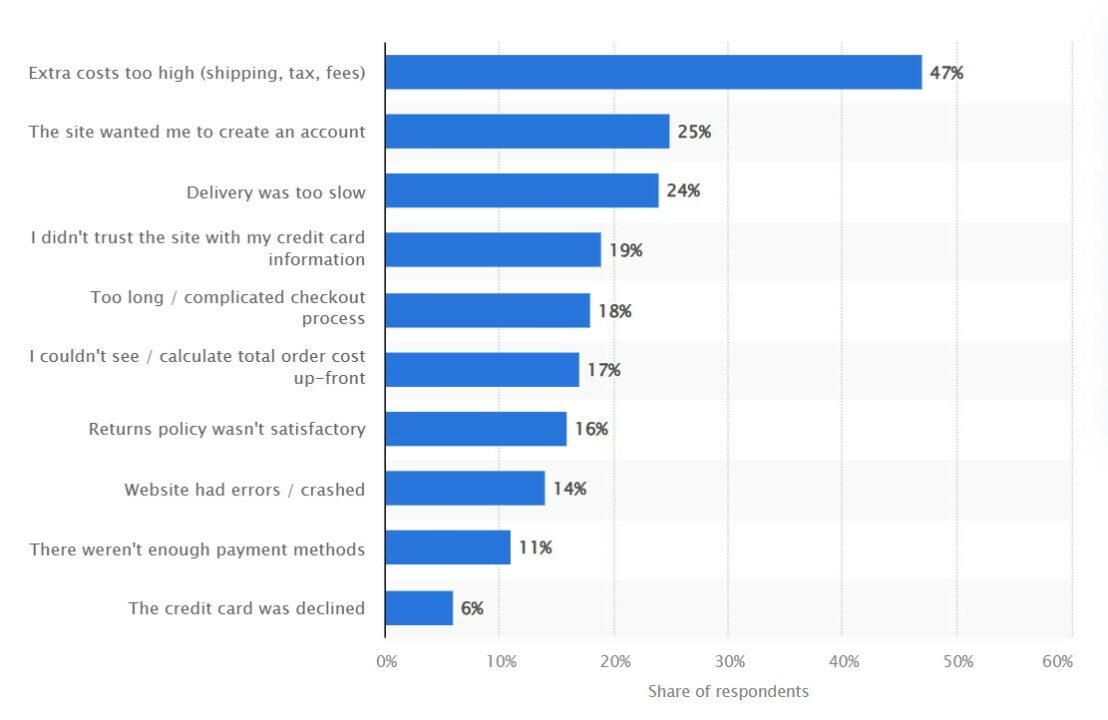
According to the Baymard Institute’s 2024 data, the top reasons shoppers abandon their carts include:
- Extra costs, such as high shipping, taxes, and fees. This accounted for 48% of abandons. Offer transparent pricing and free or discounted shipping thresholds to ease this concern.
- Being required to create an account during checkout contributed to 26% of abandonments. Address this by providing a guest checkout option or allowing users to create an account after completing their purchase.
- A lack of trust in the site’s security accounted for 25% of shopping cart abandonment. Display security badges and provide clear information about your data protection practices.
The following graph is from a 2023 Statista study with the Baymard Institute. We can see that nearly all cart abandonment stats in the categories listed increased, albeit marginally, compared to the 2024 data we’ve examined above.
Impact of cart abandonment on revenue
According to the Baymard Institute, cart abandonment causes ecommerce stores to lose $260 billion per year in recoverable sales.
However, it’s not all doom and gloom. The same study found that resolving checkout usability issues can substantially increase the conversion rate:
- Large-sized ecommerce sites could gain an average 35.26% increase in conversion rate with a better checkout flow and design.
- The combined ecommerce sales in the US and EU are $738 billion. This increase in conversion rate translates to $260 billion worth of recoverable lost orders.
The financial impact of cart abandonment extends beyond just lost sales. It also contributes to higher customer acquisition costs.
Additionally, cart abandonment can lead to a lower customer lifetime value. Customers with a poor checkout experience may be less likely to return and make future purchases.
Furthermore, businesses often incur higher retargeting costs. They impact their profitability while attempting to re-engage and convert customers who have abandoned their carts.
How to target customers who abandoned their carts
Targeting customers who have abandoned their carts is a powerful way to recover lost sales and boost revenue.
And the best part is, it’s very simple to do with email and SMS automation. Our latest report found that:
- One in three people clicking on an automated email makes a purchase. This is compared to only one in 20 campaigns.
- Welcome and cart abandonment emails convert one in every two people who click.
Maximize the impact of your automated communications using these cart abandonment solutions:
- Ensure timely and consistent communication. Set up automated cart abandonment SMS and email sequences triggered by abandonment events. Automation ensures timely follow-ups and reduces manual effort.
- Implement unique, single-use coupon codes. Offering exclusive discounts incentivizes customers to complete their purchases.
- Personalize offers and retargeted ads. Tailor your messaging and promotions based on customer behavior, preferences, and cart contents.
- Gamify abandoned cart emails. Incorporate elements like progress bars or interactive elements. These engage customers and encourage them to return to their carts.
- Use compelling email copy and strong CTAs. Craft persuasive subject lines, engaging copy, and clear calls-to-action (CTAs). Highlight the value proposition and create a sense of urgency.
Wrap up
Understanding cart abandonment stats is vital for ecommerce success.
It can help you find out why customers are leaving without buying so you can put in place clear strategies to handle the issue.
You want to ensure your store is both mobile-friendly and optimized. Additionally, make sure to implement automated abandonment flows to reengage customers and recover lost sales.
Regularly monitor cart abandonment metrics and keep optimizing to drive sales, boost conversions, and enhance customer satisfaction.
Source from Omnisend
Disclaimer: The information set forth above is provided by omnisend.com independently of Alibaba.com. Alibaba.com makes no representation and warranties as to the quality and reliability of the seller and products.