Executive summary
Amazon marketplace sellers in 2023 face numerous challenges ranging from uncertain economic climate to increased cost of goods and services, as well as increased competition from the ever growing market that is Amazon. Given the increased competition and cost pressure, pricing strategy becomes a vital lever for maximizing profits on the marketplace. Marketplace sellers however are limited to their sales data and at Threecolts we hope to demystify pricing elasticity for our partners by collating and analyzing data from various sellers to paint a more complete picture of the state of the market.
Conventionally Q4 tends to be sellers’ highest grossing time period, driven mostly by demand for Amazon prime day and the end of year holidays. In this report we dive into our Q4 2022 data to uncover insights and observations that would help our marketplace partners recognize additional value in the upcoming quarter.
For the first time we are diving into our data to address the following questions:
- How does price elasticity vary both across and within categories?
- How can challenger sellers & brands enter and compete in a competitive marketplace?
Key findings
- Price elasticity on Amazon varies by product category and furthermore differs within different bands of sales performance in a given product category. Marketplace sellers should assess their positioning on demand curves and price competitively for their expected revenue range
- The top earning product categories tend to be highly competitive markets with highly elastic demand curves. Q4 2022 sales data hints at brand preferences being a major factor in customer purchase decisions in the upper quartile of earnings
- Brand preference is a less significant factor in determining demand in the median and lower revenue generating products for a given Amazon subcategory. Smaller marketplace sellers may not easily compete at the top end of the market but there is ample opportunity to be successful on the Amazon Marketplace
Results
Statistical summary of data set
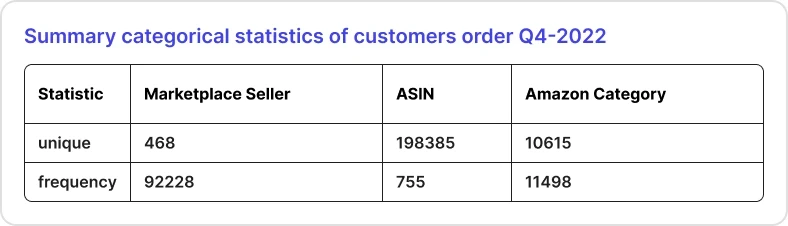
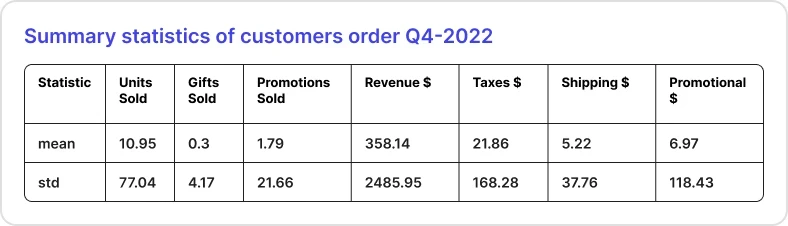
This report analyzes Q4 2022 trends for 468 Amazon sellers, covering approximately 200,000 products across 10,000+ Amazon product categories. 10.95 products are sold on average each order, of which 1.8 are promotions and 0.3 are gifts. The typical order generates $358 in sales on average and costs $7 on average for promotions. The average cost of tax is $21.86 and $5.22 respectively for shipping.
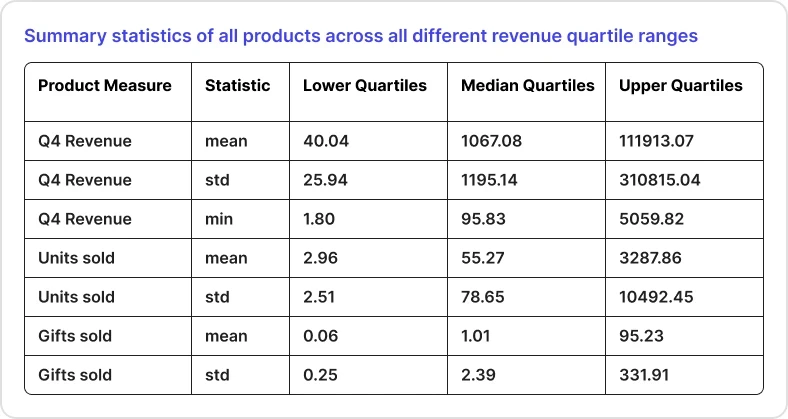
In this report, the revenue performance data was divided into three interquartile bands (lower quartile, middle quartiles, and upper quartile). The best performers on average generated 10 times as much income and sold 60 times as many units as the median performers.Top-performing items additionally sold 90 times as many items as gifts. The average number of reviews for top-performing products was 3.5 times higher than for products in the bottom quartile. Ratings are high and do not significantly differ between the categories, indicating that there are high-quality products available for a variety of performance levels.
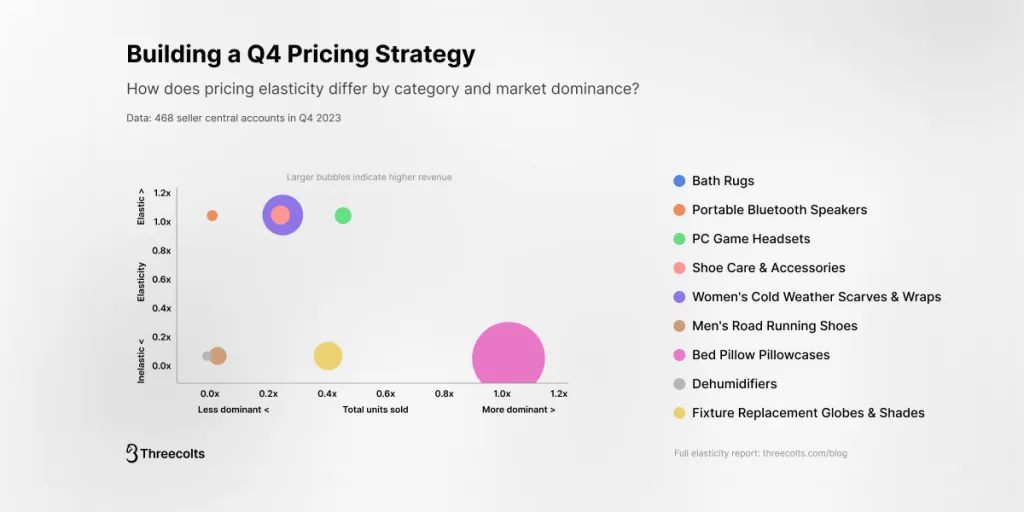
Elasticity comparisons within amazon category
In this analysis, the data was grouped by amazon parent categories. We then sampled three of the top performing categories (Electronics & Technology, Fashion & Accessories, Home & Lifestyle) and for each parent category, the subcategories were aggregated and bucketed into upper, median, and lower quartiles by revenue. One sub-category was selected from each of the three quartile bands and demand curves were charted for each of the selected sub-categories.
The subset of sampled and selected parent and sub-categories within revenue quartile bands are as follows:
Electronics & Technology
- Dehumidifiers: Upper quartile revenue generator in the Electronics & Technology category representing ASINs covering dehumidifiers
- Portable Bluetooth Speakers: Median quartile revenue generator in the Electronics & Technology category representing ASINs covering bluetooth speakers
- PC Game Headsets: Lower quartile revenue generator in the Electronics & Technology category representing ASINs covering gaming focused headsets
Fashion & Accessories
- Women’s Cold Weather Scarves & Wraps: upper quartile revenue generator in the Fashion & Accessories category representing ASINs covering scarves and head wraps for women
- Shoe Care & Accessories: median quartile revenue generator in the Fashion & Accessories category representing ASINs covering shoe care products and shoe accessories
- Men’s Road Running Shoes: lower quartile revenue generator in the Fashion & Accessories category representing ASINs covering men’s running shoes
Home & Lifestyle
- Bed Pillow Pillowcases: upper quartile revenue generator in the Home & Lifestyle category representing ASINs covering pillowcases
- Fixture Replacement Globes & Shades: median quartile revenue generator in the Home & Lifestyle category representing ASINs covering globes and shades for lighting fixtures
- Bath Rugs: lower quartile revenue generator in the Home & Lifestyle category representing ASINs covering bath rugs
Electronics & Technology
Upper Quartile
Figure 1: Demand Curve of Dehumidifiers across Revenue Quartiles
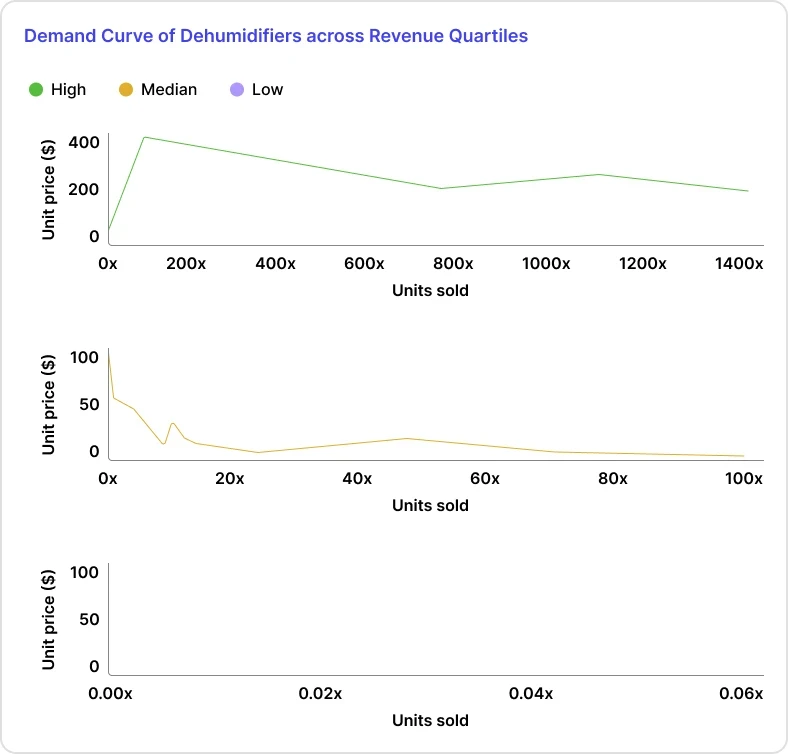
Dehumidifiers represent one of the top earning subcategories under the ‘Electronics & Technology‘ parent category. The demand curves indicate:
- Highly elastic market in the upper quartile with higher average price points and demand spikes suggesting consumers preference for quality dehumidifiers over cheaper alternatives. This is also probably due in part to COVID-19 effects and consumers choosing to prioritize premium air quality over a cheaper product.
- Very elastic demand in median quartiles with fewer suggestions of consumer brand preference (fewer spikes in demand curve)
Median Quartile
Figure 2: Demand Curve of Portable Bluetooth Speakers across Revenue Quartiles
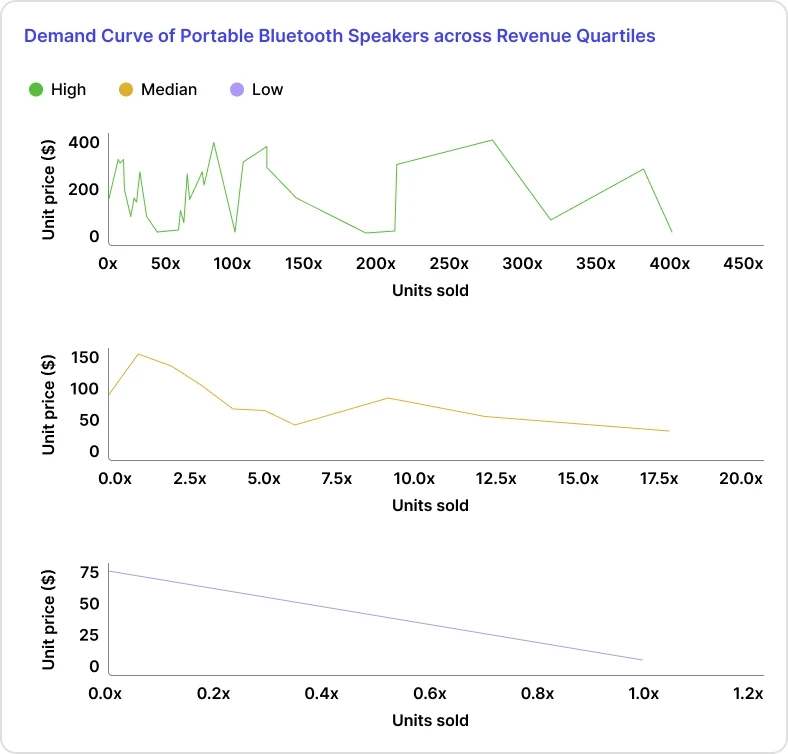
Portable bluetooth speakers represent a median earning subcategory under the ‘Electronics & Technology’ umbrella. The demand curves indicate:
- Highly elastic demand curve overall with higher average unit prices and suggestions of brand preference (spikes in demand) in the upper earning quartile
- Very elastic approaching unit elastic demand curve with fewer brand preferences (fewer demand spikes on the curve)
- Unit elastic demand in the lower quartile indicating negligible consumer preference at the lower price points and pricing being the most important factor in this revenue band. It is noteworthy that the volume of products sold in this quartile is markedly lower than the higher quartiles
Lower Quartile
Figure 3: Demand Curve of PC Game Headsets across Revenue Quartiles
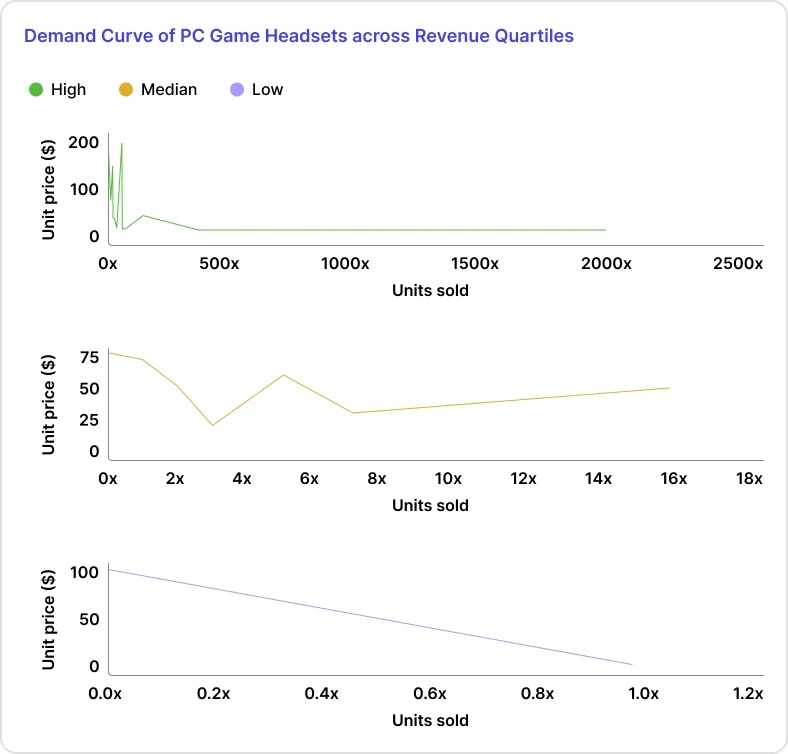
PC game headsets represent a lower earning subcategory under the ‘Electronics & Technology’ umbrella. The demand curves indicate:
- Highly elastic demand curve overall with higher average unit prices and strong suggestions of brand preference (spikes in demand at higher price points) in the upper earning quartile
- Very elastic approaching perfectly elastic demand curve with fewer brand preferences (fewer demand spikes on the curve)
- Unit elastic demand in the lower quartile indicating negligible consumer preference at the lower price points and pricing being the most important factor in this revenue band. It is noteworthy that the volume of products sold in this quartile is markedly lower than the higher quartiles
Fashion & Accessories
Upper Quartile
Figure 4: Demand Curve of Women’s Cold Weather Scarves & Wraps across Revenue Quartiles
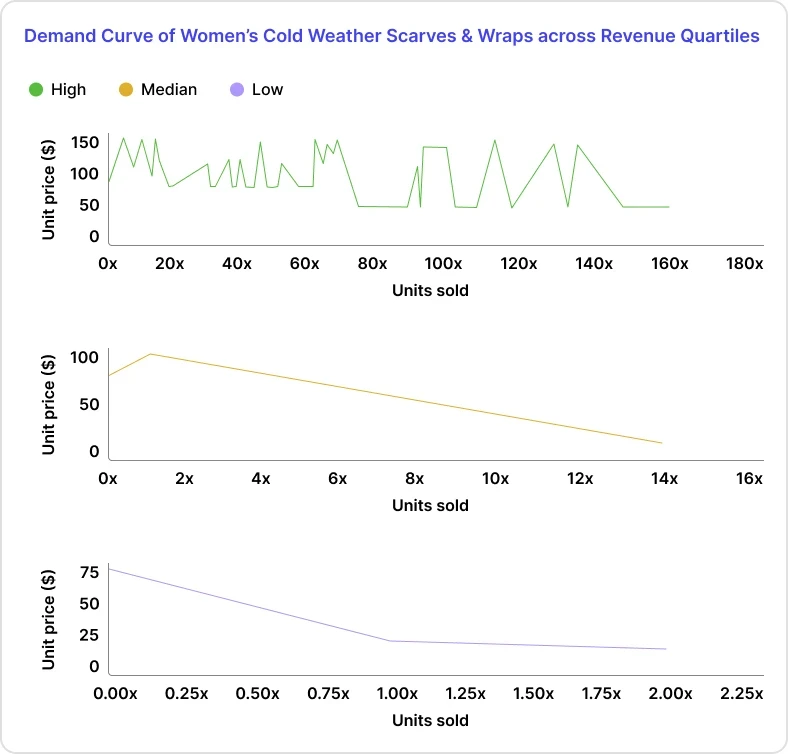
Women’s cold weather scarves & wraps represent an upper quartile earning subcategory under the ‘Fashion & Accessories’ umbrella. The demand curves indicate:
- Highly elastic demand curve overall with higher average unit prices and strong suggestions of brand preference (spikes in demand at higher price points along the curve) in the upper earning quartile. The high frequency of spikes additionally suggests a highly competitive market with multiple brand preferences
- Very elastic approaching unit elastic demand curve with very few brand preferences (singular demand spikes along the curve)
- Unit elastic demand in the lower quartile with a price floor indicating negligible consumer preference at the lower price points and pricing being the most important factor in this revenue band. It is noteworthy that the volume of products sold in this quartile is markedly lower than the higher quartiles
Median Quartile
Figure 5: Demand Curve of Men’s Road Running Shoes across Revenue Quartiles
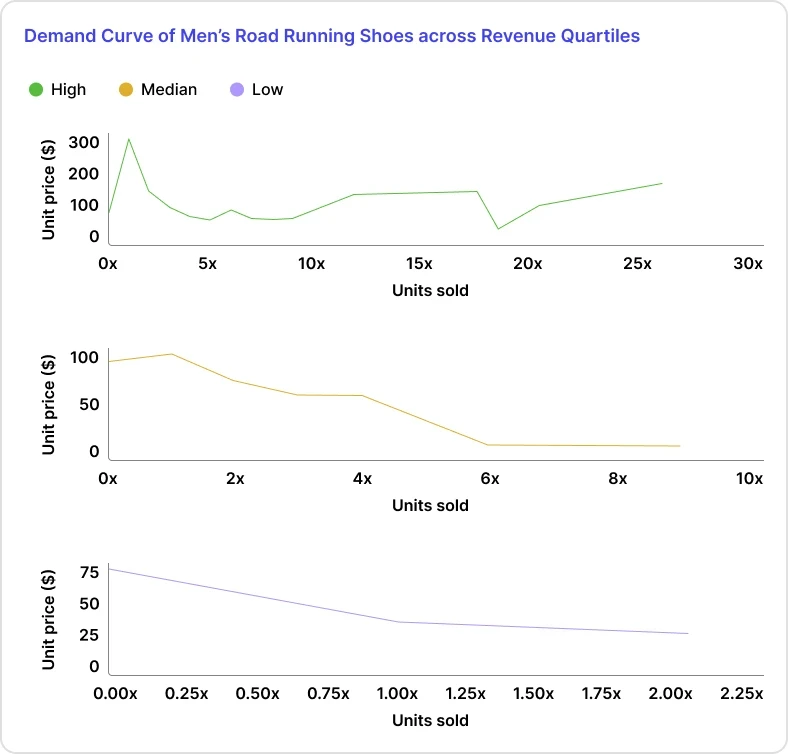
Men’s road running shoes represent a median quartile earning subcategory under the ‘Fashion & Accessories’ umbrella. The demand curves indicate:
- Highly elastic demand curve overall with higher average unit prices and some suggestions of brand preference (spikes in demand at higher price points along the curve). The demand curve is relatively smooth indicating a highly competitive demand market
- Very elastic approaching unit elastic demand curve with very few brand preferences (sparse spikes along the curve) and a price floor for running shoes suggesting consumers are not willing to buy shoes of perceived lesser quality based on price
- Unit elastic demand in the lower quartile with a price floor indicating negligible consumer preference at the lower price points and pricing being the most important factor in this revenue band. The price floor for running shoes in this band suggests consumers are not willing to buy shoes of perceived lesser quality based on price (~$30)
Lower Quartile
Figure 6: Demand Curve of Shoe Care & Accessories across Revenue Quartiles
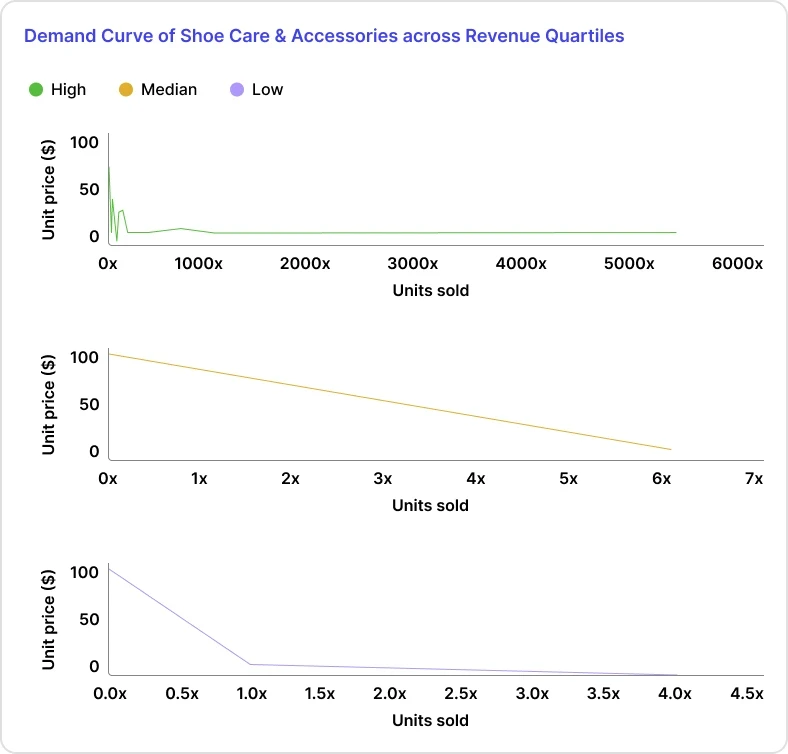
Men’s road running shoes represent a median quartile earning subcategory under the ‘Fashion & Accessories’ umbrella. The demand curves indicate:
- Upper tier of revenue generation displays close to perfect elasticity with some suggestions of brand preference (spikes in demand at higher price points along the curve). The demand curve is relatively smooth indicating a highly competitive demand market with pricing being a major factor in consumer purchase decisions
- Median tier of revenue generation displays unit elastic demand curve suggesting price is the primary determinant of consumer purchase decisions
- The lower quartile exhibits unit elastic demand for products ~$10 and up and highly elastic demand for products < $10 suggesting pricing being the most important factor in this revenue band with limited consumer preferences in this category and revenue band
Home & Lifestyle
Upper Quartile
Figure 7: Demand Curve of Bed Pillow Pillowcases across Revenue Quartiles
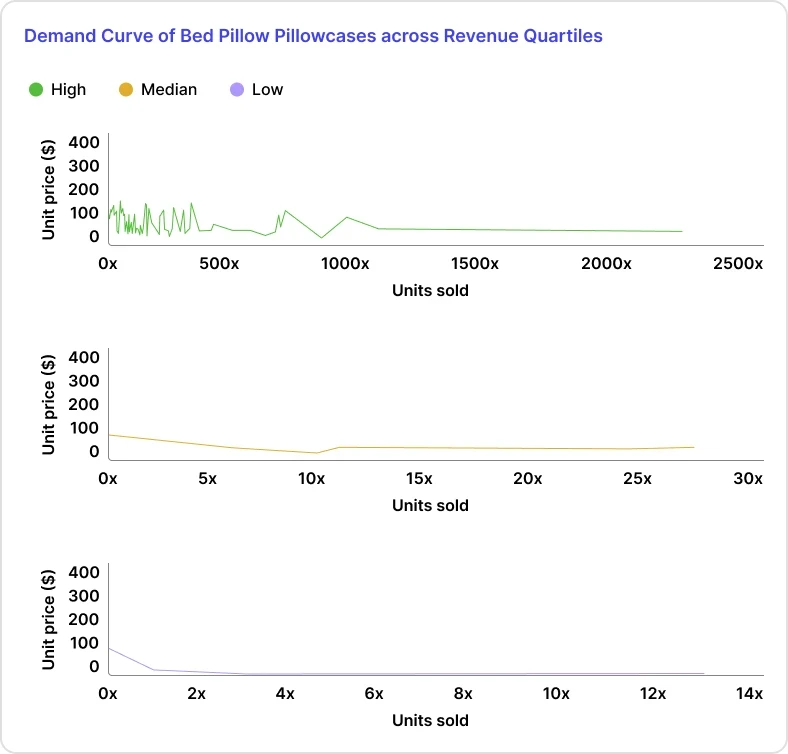
Bed pillow pillowcases represent an upper quartile earning subcategory under the ‘Home & Lifestyle’ umbrella. The demand curves indicate:
- Upper tier of revenue generation displays close to perfect elasticity with high suggestions of brand preference (spikes in demand at higher price points along the curve). The demand curve is relatively smooth overall indicating a highly competitive demand market with pricing being a major factor in consumer purchase decisions outside of preferred brands
- Median tier of revenue generation displays close to perfect elasticity suggesting price is the primary determinant of consumer purchase decisions
- The lower quartile exhibits unit elastic demand for products ~$10 and up and highly elastic demand for products < $10 suggesting pricing being the most important factor in this revenue band with limited consumer preferences in this category and revenue band
Median Quartile
Figure 8: Demand Curve of Fixture Replacement Globes & Shades across Revenue Quartiles
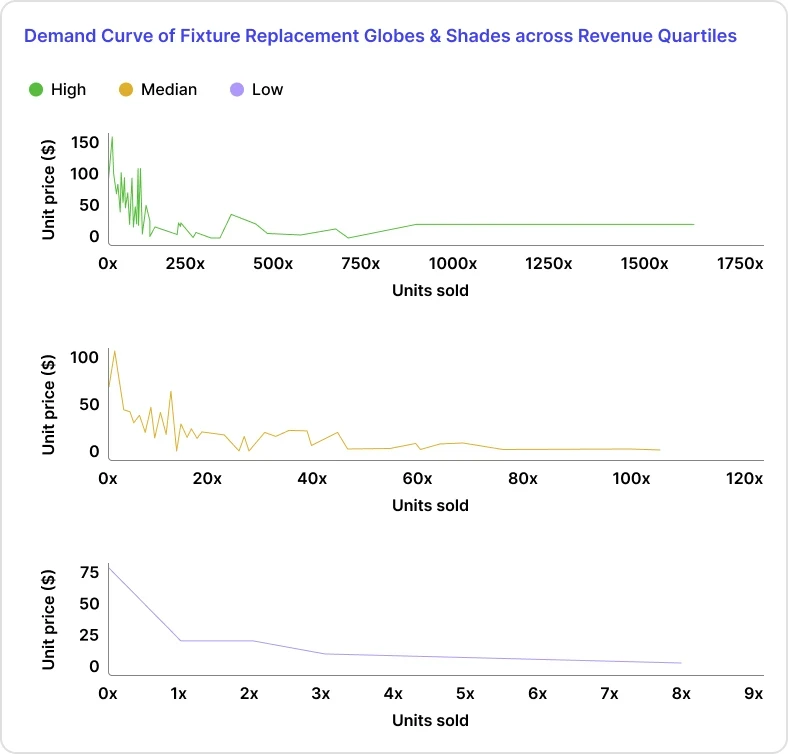
Fixture replacement globes & shades represent a median quartile earning subcategory under the ‘Home & Lifestyle’ umbrella. The demand curves indicate:
- Upper tier of revenue generation displays high elasticity with very strong suggestions of brand preference (spikes in demand at higher price points along the curve). The demand curve is relatively smooth otherwise indicating a highly competitive demand market with pricing being a major factor in consumer purchase decisions outside of brand preference
- Median tier of revenue generation displays high elasticity with indications of consumer preference along the curve. The general trend of demand suggests price is a key determinant of consumer purchase decisions along with brand preference
- The lower quartile exhibits unit elastic demand for products above $30 and highly elastic demand for products below $20 suggesting pricing being the most important factor in this revenue band with limited consumer preferences in this category and revenue band
Lower Quartile
Figure 9: Demand Curve of Bath Rugs across Revenue Quartiles
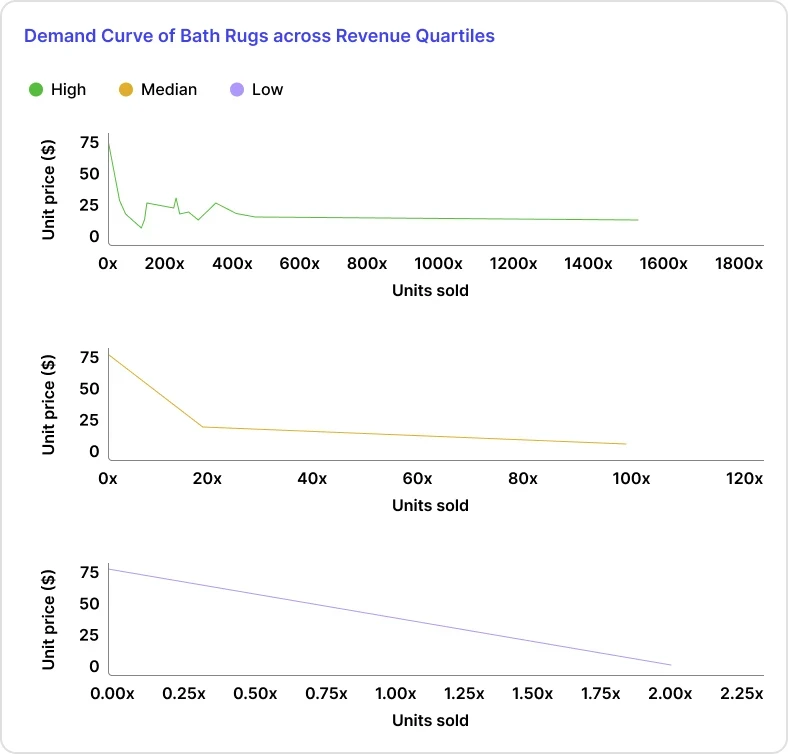
Bath rugs represent a lower quartile earning subcategory under the ‘Home & Lifestyle’ umbrella. The demand curves indicate:
- Upper tier of revenue generation displays close to perfect elasticity with some suggestions of brand preference (spikes in demand at higher price points along the curve). The demand curve is relatively smooth otherwise indicating a highly competitive demand market with pricing being a major factor in consumer purchase decisions outside of brand preference
- The median quartile exhibits unit elastic demand for products above $30 and highly elastic demand for products below $30 suggesting pricing being the most important factor in this revenue band with limited consumer preferences in this category and revenue band
- The lower quartile exhibits unit elastic demand for products in this revenue band suggesting pricing being the most important factor to consumers in this subcategory tier
Conclusion
Our data provided a strong contextual basis for investigating Amazon marketplace trends and elasticity across the varied categories serviced. The analysis of sales trends found that Q4 sales have a bimodal distribution with peak sales periods occurring during key promotional periods.
In assessing pricing elasticity both across parent categories and for different revenue performance bands within selected sub-categories we uncovered that price elasticity of demand varies both across and within groups. The sampled categories from the top revenue generating categories tend to exhibit highly elastic demand at the highest revenue bands within the categories. There are strong signs however that product and brand preference does play a part in purchase decisions as suggested by spikes in their demand curves. It is noteworthy that the products in high performing selected sub-categories (Women’s cold weather scarves & wraps, Bed pillow pillowcases, and dehumidifiers) tend to be frequently used products vs. the lower performing categories selling sporadically purchased products such as PC game headsets, shoe care & accessories, and bath rugs. We further noted that in some categories there were price floors suggesting a customer’s perception of product quality could be impacted by pricing.
Overall or analysis indicates that in general top revenue performance bands within a given subcategory tend to exhibit trends of brand preference and that brand preference becomes less significant with lower average unit prices and in less performant revenue tiers. Challenger brands looking to enter competitive markets must thus work to boost brand recognition and leadership to compete at the highest end of the market. A good starting point for this is to have a well reviewed and highly rated product. With fierce competition on the Amazon marketplace brands could also seek to offer promotions to boost market share however promotions should be structured in accordance with the elasticity exhibited for a given product category.
Methodology
The data presented above represents an aggregated, anonymized view into the amazon marketplace transactions of a subset of our customers. The data presented in this report is a snapshot of Q4 2022 marketplace sellers. For the purposes of this report, we limited the scope of marketplace participants to sellers with a minimum total revenue of $50,000 over the Q4 2022 period.
All revenue figures are represented in USD ($), and any conversions were carried out using Q4 2022 exchange rate averages over the period.
For the purposes of this study, it is assumed that items in a particular Amazon category are reasonably comparable and interchangeable.
Note: A product can be affiliated with multiple categories and thus could count multiply across categories in some cases.
Source from Threecolts
The information set forth above is provided by Threecolts independently of Alibaba.com. Alibaba.com makes no representation and warranties as to the quality and reliability of the seller and products.