Data is the new oil for businesses. It’s not just a buzzword; it’s what allows enterprises to make sense of their supply chain networks and take action based on that knowledge. And when it comes to logistics management, data analytics can reveal insights about the business processes that will help managers optimize them for maximum efficiency and productivity.
But how can businesses measure logistics performance? How do they know what KPI or metric will tell them about where their operations are succeeding or failing? In this blog post, we’ll explore some of the most important KPIs and metrics for measuring logistics performance—and why they matter so much!
Table of Contents
What is a logistics key performance indicator (KPI)?
What is the difference between KPIs and metrics?
Top 10 KPIs and metrics to track logistics performance
Integrating KPIs into a logistics performance scorecard
KPIs are the cornerstone for continuous improvement
What is a logistics key performance indicator (KPI)?
Logistics key performance indicators (KPIs) are quantitative metrics that show how well a business is performing on its supply chain journey from resource procurement to final delivery. They can be used to measure multiple aspects of logistics operations, including transport-related costs and performance, inventory management, order fulfillment, and customer satisfaction.
What is the difference between KPIs and metrics?
When it comes to measuring logistics performance, both KPIs and metrics play crucial roles as quantifiable measures. However, there’s a key difference between the two that sets them apart.
KPIs are directly connected to the strategic logistics goals of a company, helping to evaluate progress and effectiveness in achieving these objectives. Metrics, on the other hand, focus on tracking and assessing the status of specific processes, activities, or performance aspects, providing valuable insights into various areas of the business.

It’s essential to remember that while all KPIs are indeed metrics, not all metrics can be considered KPIs. KPIs concentrate on overall performance and progress toward strategic goals, whereas metrics delve deeper into the contributing factors behind that performance.
Top 10 KPIs and metrics to track logistics performance
With a clear understanding of what a KPI is and how it stands apart from a metric, it’s time to dive into the top 10 KPIs and metrics that can help businesses fine-tune their logistics operations. We’ll take a closer look at each KPI, demystify its components, and offer practical examples to make measuring them a breeze.
On-time delivery rate
This is a crucial logistics KPI that measures the percentage of shipments delivered within the agreed-upon timeframe. By tracking on-time delivery rates, businesses can evaluate the efficiency of their logistics operations and the quality of their customer service. A high on-time delivery rate indicates that the company is meeting its delivery commitments and keeping customers satisfied.
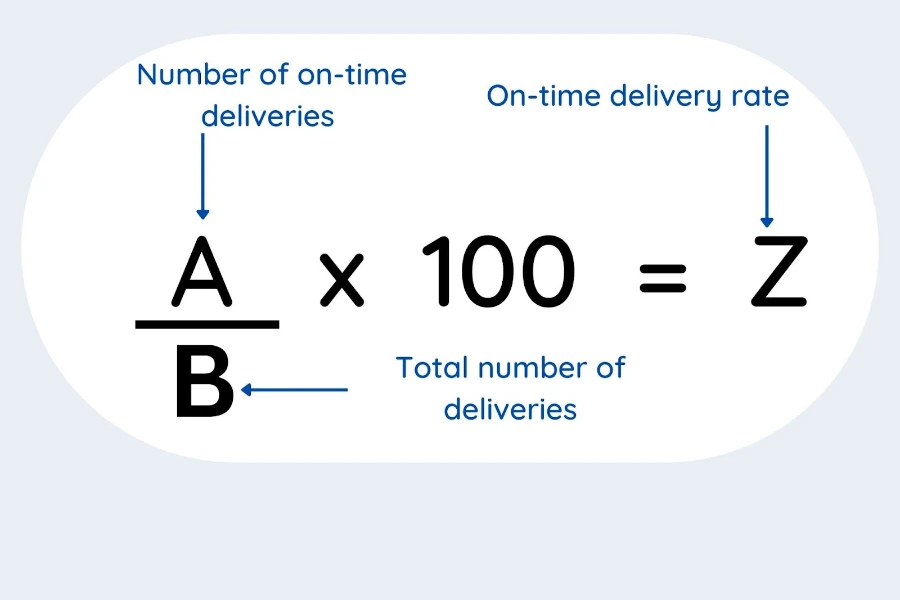
To calculate the on-time delivery rate, simply divide the number of on-time deliveries by the total number of deliveries, and then multiply the result by 100 to get the percentage. For example, if a company has made 90 on-time deliveries out of 100 total deliveries, the on-time delivery rate would be (90/100) x 100 = 90%.
Order accuracy
This vital logistics KPI measures the percentage of orders delivered without any errors, such as incorrect items, quantities, or damaged goods. By keeping track of order accuracy, businesses can ensure that their logistics operations are running smoothly and efficiently while maintaining high levels of customer satisfaction.
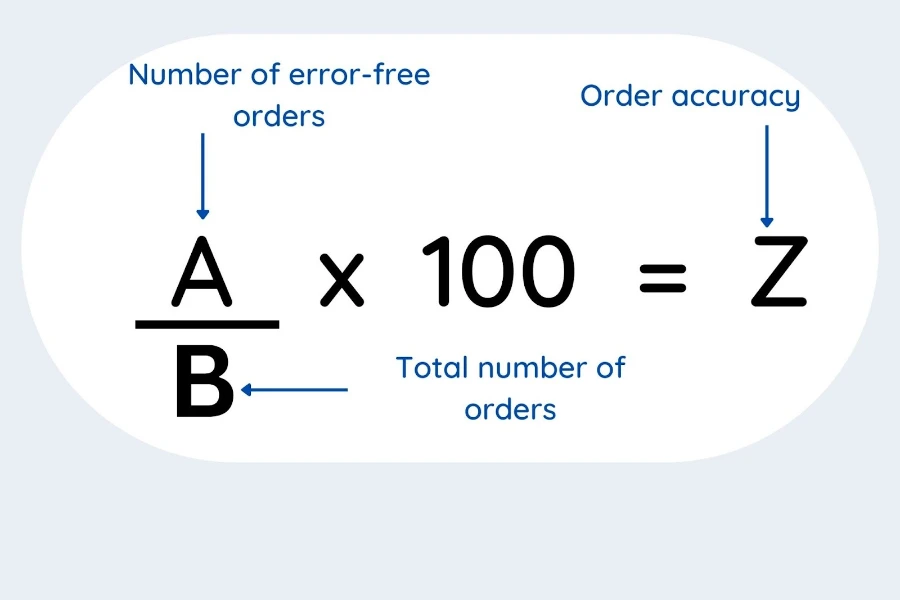
Calculating order accuracy is straightforward. Simply divide the total number of error-free orders by the total number of orders and multiply the result by 100 to obtain the percentage. For instance, if a business has delivered 95 error-free orders out of a total of 100 orders, the order accuracy rate would be (95/100) x 100 = 95%.
Inventory turnover
This is an essential logistics KPI that measures the ratio of the cost of goods sold (COGS) to the average inventory held during a specific period. By monitoring inventory turnover, businesses can evaluate how efficiently they are selling their inventory and managing stock levels. A high inventory turnover indicates that the company is effectively moving its products, which can lead to lower holding costs and improved cash flow.
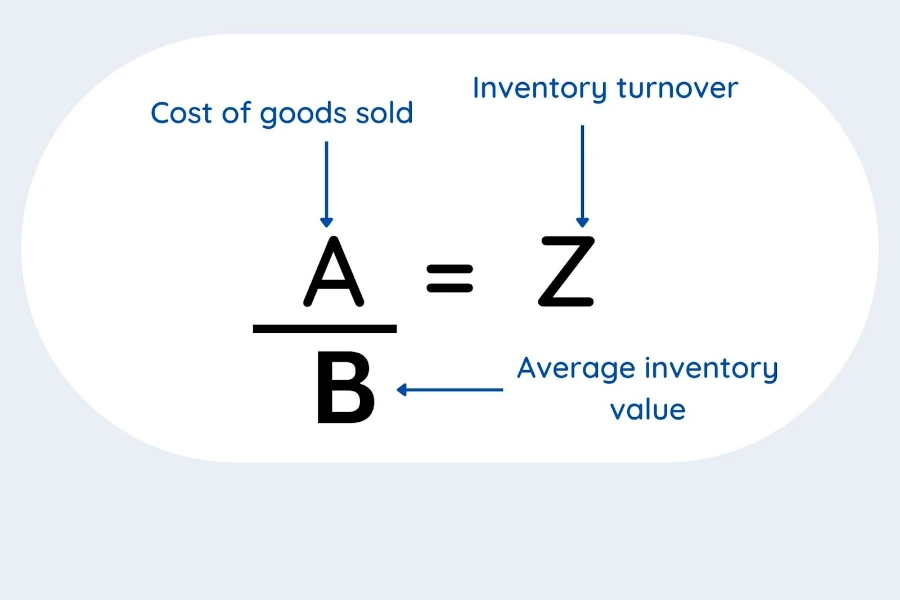
To calculate inventory turnover, simply divide the COGS by the average inventory value for the period. For example, if a company has a COGS of $500,000 and an average inventory value of $100,000 during a given period, the inventory turnover would be 500,000 / 100,000 = 5. This means that the company’s inventory has turned over five times during that period.
Warehouse utilization
Warehouse utilization, a crucial logistics KPI, assesses the effective use of warehouse space. By monitoring this KPI, businesses can evaluate their storage capacity management and identify optimization opportunities. A higher warehouse utilization percentage signifies efficient use of storage space, resulting in cost savings and enhanced operational efficiency.
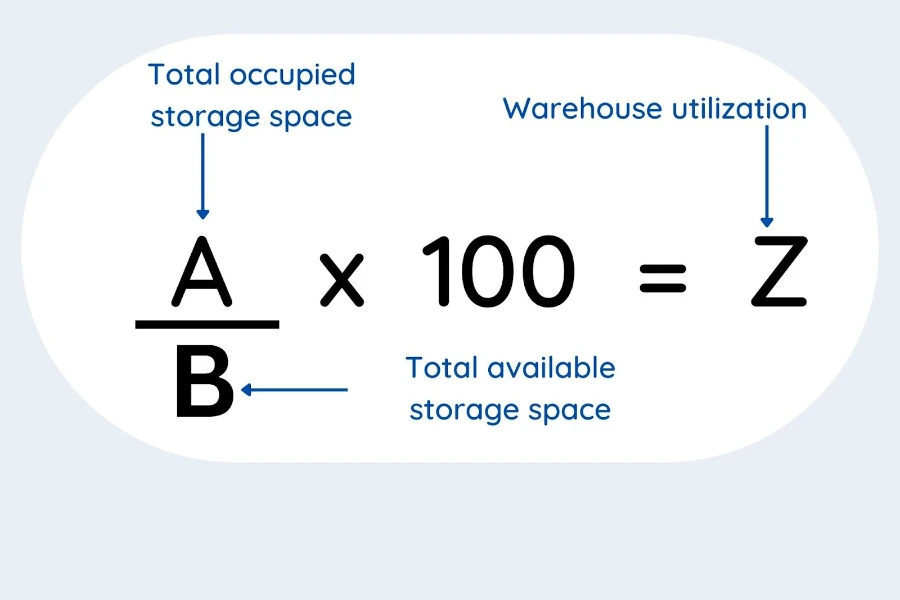
Calculating warehouse utilization is simple. Divide the total occupied storage space by the total available storage space, and then multiply the result by 100 to get the percentage. For example, if a warehouse has 8,000 square feet of occupied storage space and a total of 10,000 square feet of available storage space, the warehouse utilization would be (8,000/10,000) x 100 = 80%.
Transportation cost per unit
This KPI evaluates the average cost of transporting a single unit of cargo. By monitoring this metric, businesses can keep track of and manage their freight expenses, ensuring that transportation costs remain within budget. A lower transportation cost per unit suggests that the company is effectively handling its carrier relationships and logistics processes, leading to overall cost savings and enhanced profitability.
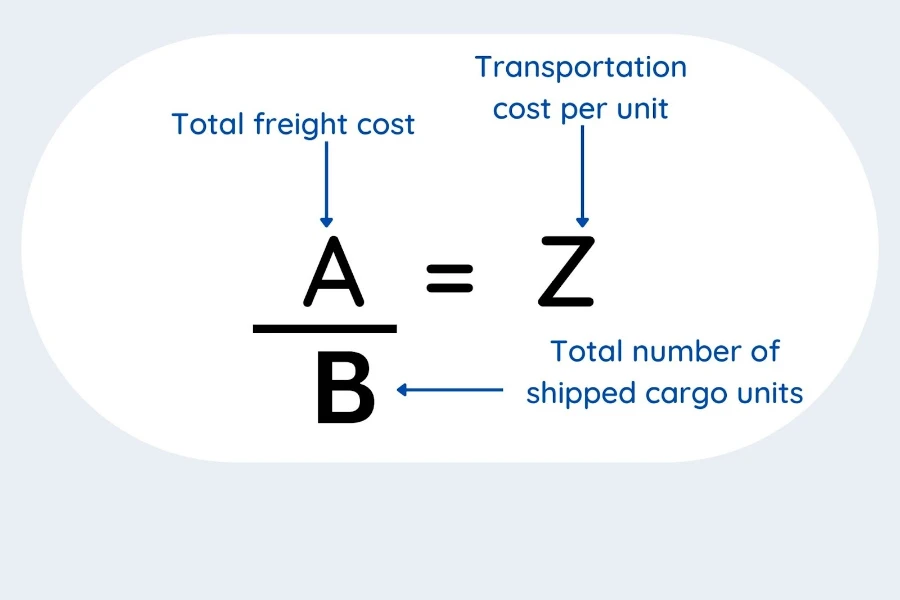
Calculating transportation cost per unit is simple. Divide the total freight cost by the total number of cargo units shipped during a specific period. For instance, if a company incurs $15,000 in freight costs while shipping 3,000 units, the transportation cost per unit would be $15,000 / 3,000 = $5.
Average order processing time
This crucial logistics KPI measures the time it takes to process an order from receipt until it is ready for shipping. By tracking this metric, businesses can evaluate the efficiency of their order fulfillment processes and identify areas for improvement. A shorter average order processing time indicates that the company is quickly preparing orders for load and shipping, which can lead to increased customer satisfaction and better operational efficiency.
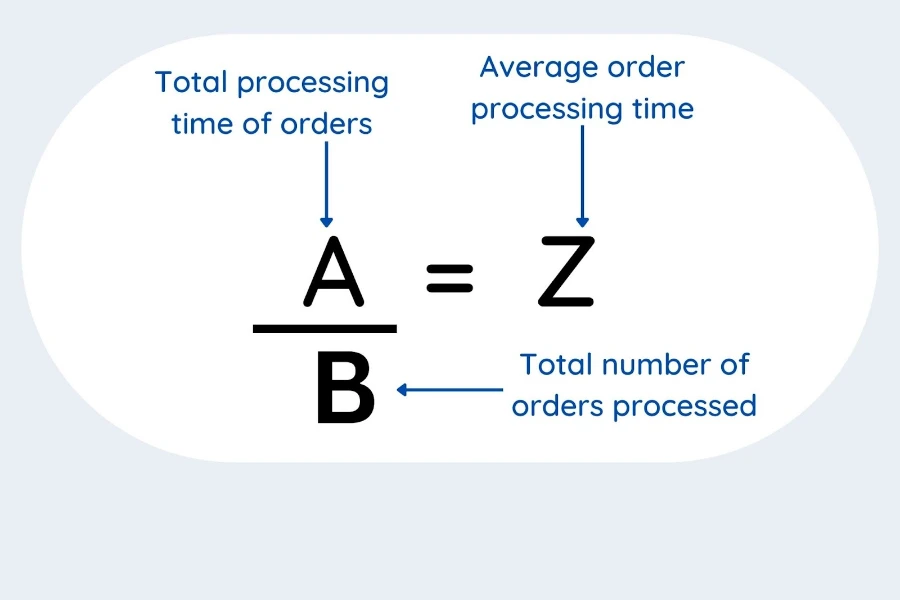
Calculating average order processing time is straightforward. First, determine the total processing time for all orders during a specific period, and then divide that by the total number of orders processed. For example, if a company processes 100 orders with a combined processing time of 200 hours, the average order processing time would be 200 / 100 = 2 hours.
Order cycle time
Order cycle time is a valuable logistics KPI that tracks the time it takes to fulfill an order from placement to delivery. Keeping an eye on this metric helps businesses gauge the efficiency of their order fulfillment process and pinpoint areas for improvement. A shorter order cycle time means the company is effectively handling order processing, shipping, and delivery, leading to happier customers and smoother operations.
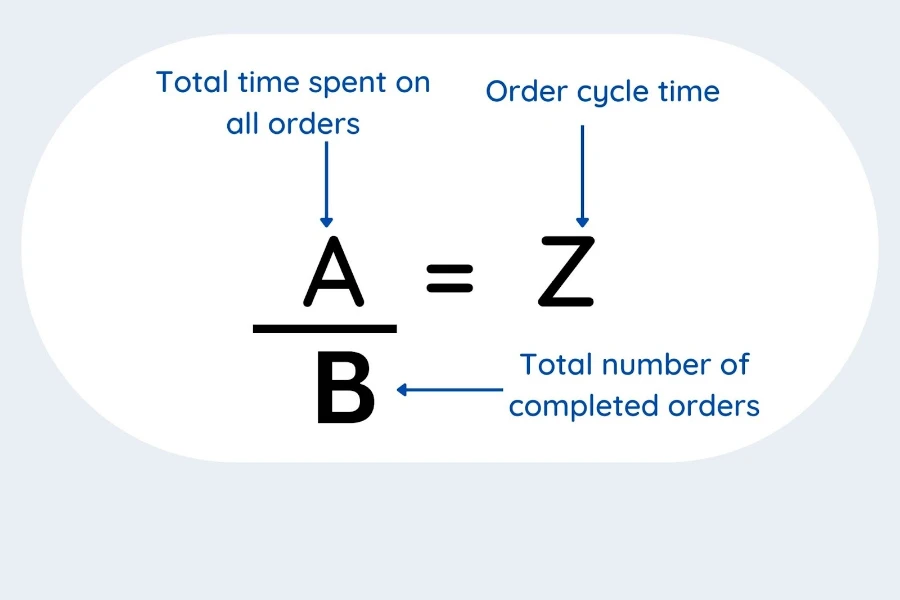
To calculate order cycle time, simply determine the total time spent on all orders from placement to delivery during a specific period, then divide that by the total number of completed orders. For instance, if a company finishes 100 orders with a combined cycle time of 400 hours, the average order cycle time would be 400 / 100 = 4 hours.
Freight cost per shipment
Freight cost per shipment is a practical logistics KPI that calculates the average cost of transporting a single shipment. Keeping track of this metric allows businesses to manage their shipping expenses effectively and stay within budget. A lower freight cost per shipment indicates that the company is successfully optimizing its logistics operations and forging strong partnerships with carriers.
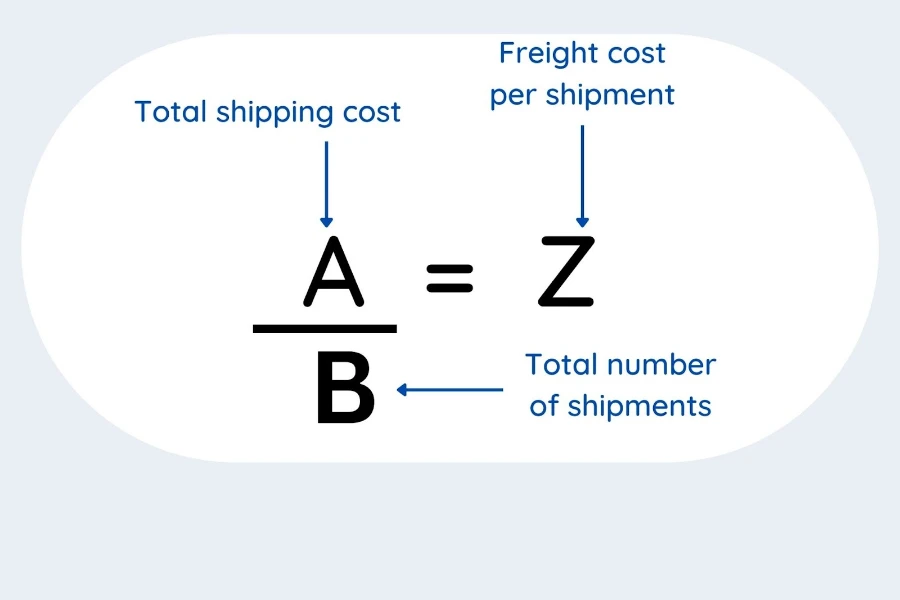
To measure freight cost per shipment, divide the total shipping cost by the total number of shipments during a specific period. For example, if a company spends $200,000 on shipping 2,000 shipments, the freight cost per shipment would be $200,000 / 200 = $1,000.
Order fill rate
This is a useful logistics KPI that measures the percentage of customer orders that are fulfilled completely and on time. Tracking this metric helps businesses evaluate their ability to meet customer demands and maintain inventory levels. A higher order fill rate indicates that the company effectively manages its inventory and order fulfillment processes.
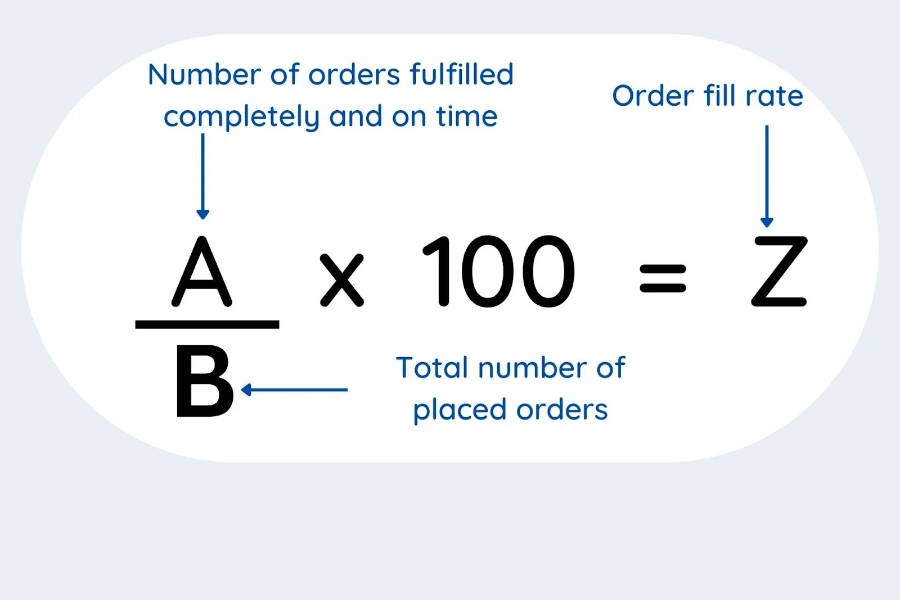
To calculate the order fill rate, divide the total number of orders fulfilled completely and on time by the total number of orders placed during a specific period, then multiply by 100 to get the percentage. For example, if a company receives 150 orders and successfully fulfills 135 of them on time, the order fill rate would be (135 / 150) * 100 = 90%.
Backorder rate
Last but not least, the backorder rate is a valuable logistics KPI that measures the proportion of unfulfillable orders due to stock shortages. This metric allows businesses to evaluate their inventory management and pinpoint areas for improvement. A lower backorder rate indicates effective inventory control and reduced order delays.
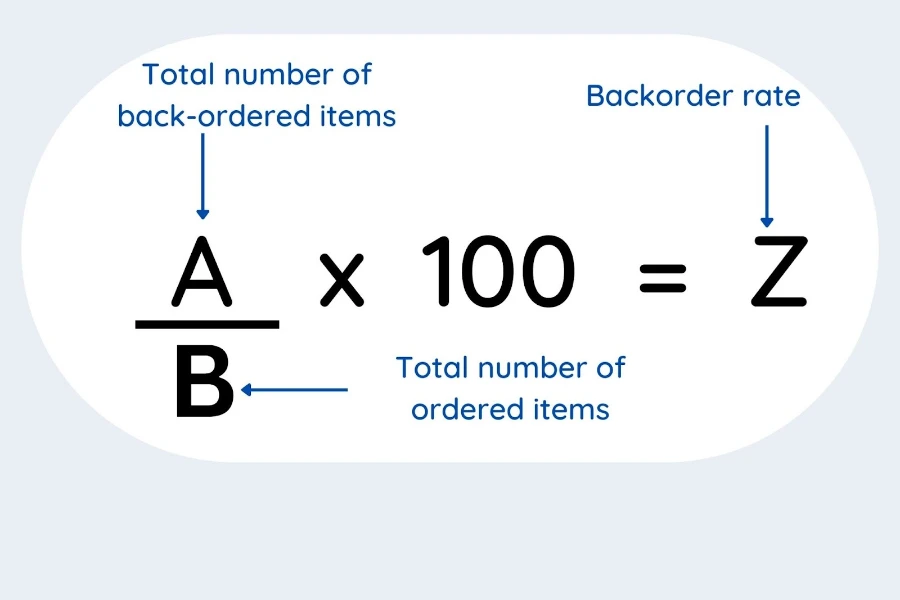
To measure the backorder rate, divide the total number of back-ordered items by the total number of items ordered during a specific period, then multiply by 100 to get the percentage. For example, if a company receives orders for 500 items and has to backorder 50, the backorder rate would be (50 / 500) * 100 = 10%.
Integrating KPIs into a logistics performance scorecard
Integrating logistics KPIs into a single dashboard offers businesses a holistic view of their entire supply chain. This comprehensive approach enables them to monitor and evaluate all logistics stages, such as inventory management, supply, order management, distribution, and transport management. With this all-encompassing overview, businesses can pinpoint areas for improvement, streamline operations, and enhance overall efficiency.
Building a logistics scorecard starts with identifying the most relevant KPIs for each stage of the logistics process. These KPIs should provide a well-rounded view of performance and align with the company’s strategic goals. After selecting the KPIs, organize them into a visually appealing and easy-to-understand format, like a grid or table. This layout should have rows representing different logistics stages and columns for each KPI, making it simple for decision-makers to assess performance at a glance.
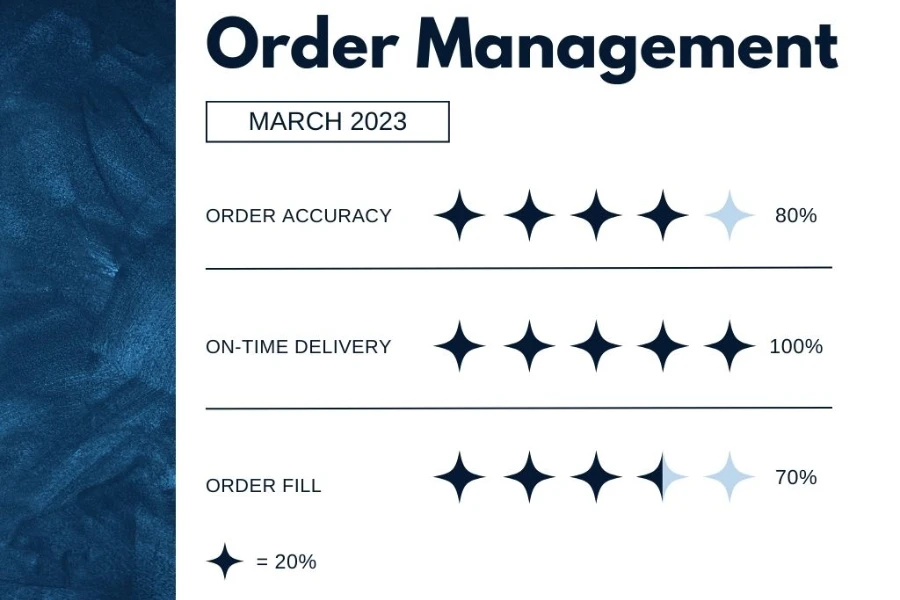
A well-designed logistics scorecard not only showcases the current performance of each KPI but also allows for tracking trends and progress over time. By consistently updating the scorecard with the latest data and comparing it to historical performance or industry benchmarks, businesses can quickly identify areas needing attention and make informed decisions to optimize their logistics processes.
KPIs are the cornerstone for continuous improvement
In the hustle and bustle of managing complex supply chains, it’s easy for businesses to lose sight of the bigger picture. However, without measuring performance and pinpointing areas for improvement, they might miss out on optimizing their logistics operations.
That’s where KPIs play a crucial role, serving as a roadmap for continuous improvement. KPIs offer businesses a clear view of what’s working, what needs a boost, and how to make those necessary changes. By leveraging KPIs, companies can identify the most effective logistics strategies to boost profits and fine-tune their supply chain.
Interested in taking logistics performance to the next level? If yes, check out this comprehensive guide that covers everything businesses need to know about logistics planning and how to do it successfully.
Looking for a logistics solution with competitive pricing, full visibility, and readily accessible customer support? Check out the Alibaba.com Logistics Marketplace today.