In California, an increase in power sector greenhouse gas emissions, particularly from in-state generation, in recent years is offsetting progress made in the transportation sector, and threatening the state’s goals overall, according to the 15th annual California Green Innovation Index, released by the nonpartisan nonprofit Next 10 and prepared by Beacon Economics.
California has worked hard to decouple its economy from the burning of fossil fuels, resulting in some of the lowest per-capita emissions in the United States, but annual greenhouse gas jumped 3.4% in 2021, a rebound following the pandemic, according to the latest data from the California Air Resources Board (CARB). A preliminary estimate from the agency shows the state’s emissions started trending downward again in 2022, but the 2021 emissions remained 121.3 MMTCO2e above the 2030 target of nearly 260 MMTCO2e.
The increase in emissions following the pandemic makes it all the more difficult for California to meet its climate goals on time. In fact, we may be further behind than many people realize. If you look at the trajectory since 2010, California won’t meet our 2030 climate goal until 2047. We need to triple the rate of decarbonization progress each year to hit that target.
—F. Noel Perry, Founder of Next 10

Efforts to promote renewable power as well as zero-emission buildings and vehicles will have to dramatically accelerate in order to achieve the state’s goal of slashing greenhouse gas emissions by 40% below 1990 levels by 2030, according to the new report. To meet that benchmark, California would need to triple the rate of emissions cuts made since 2010—going from the actual average annual reduction of about 1.5% a year to about 4.6% a year, according to an analysis of CARB data by Beacon Economics. That percentage could be even higher as emissions data for 2023 isn’t available yet.
Emissions from the transportation sector—which accounts for nearly 40% of the state’s carbon footprint—increased by 7.4% from 2020 to 2021 following the easing of pandemic travel restrictions. But overall, greenhouse gas emissions from passenger cars, heavy-duty trucks, and other vehicles were more than 10% lower in 2021 compared to 2019. This shows the state is making considerable progress cutting its largest source of pollution. Emissions from heavy-duty vehicles have consistently decreased every year since 2018, resulting in a 14.1% reduction in 2021 compared to that year.
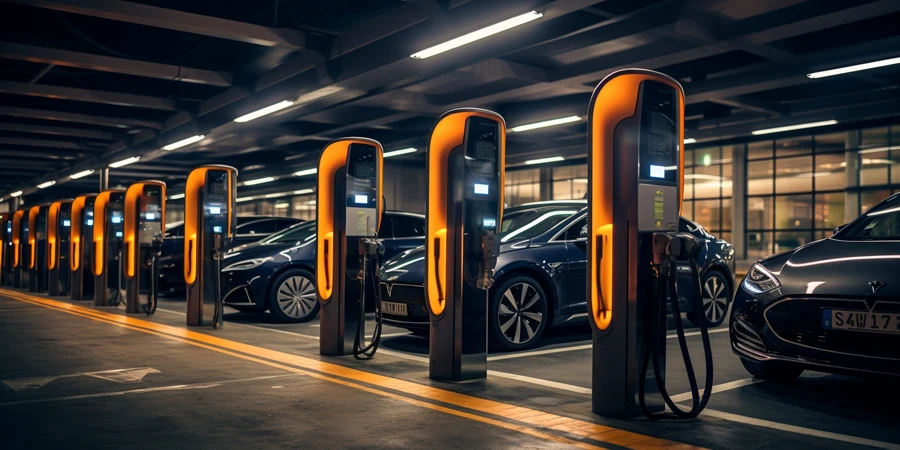
Zero-emission vehicle adoption is now at an all-time high in California, accounting for a quarter of new vehicle sales in 2023. New light-duty electric vehicle sales in all classes rose by 61.7% in 2022 compared to the previous year, and the state met its 2025 goal of 1.5 million ZEVs onroad two years early in April 2023. At the current trajectory (an increase in sales of 25.6% on average per year from 2018 to 2023), California is on track to meet the 2030 target of 5 million ZEVs one year ahead of schedule as well.
Buildings are slowly getting cleaner too, especially with the adoption of electric heat pumps, induction stoves, and efficiency upgrades that lower demand for fossil gas. Emissions from the commercial and residential sectors declined by roughly 4.5% and 4.4%, respectively, in 2021 compared to pre-pandemic levels in 2019. However, while residential emissions fell (-2.3%), commercial emissions increased from 2020 to 2021 (+3.7%), as anticipated post-pandemic.
Electricity generation experienced the largest increase in greenhouse gas emissions among all economic sectors from 2019 to 2021, jumping 3.5%. This was driven by a substantial increase in emissions from in-state power generation, which jumped 10.3% between 2019 and 2021. Despite these increases, in February 2024, the California Public Utilities Commission (CPUC) adopted a more ambitious goal for decarbonizing the electricity sector, calling for 58% fewer emissions by 2035 compared to 2020.
Beacon Economics estimates that to achieve this target, California must reduce power sector emissions by an average of 6.3% annually between 2021 and 2035—nearly double the 3.5% annual average decrease rate observed from 2011 to 2021. Moreover, recent trends indicate an upward trajectory, with a 4.8% year-over-year increase in emissions from 2020 to 2021.
While California is moving in the right direction in many ways, renewable electricity generation must greatly increase in the coming years in order to reach the state’s goal. To meet our upcoming target of 50% of electricity from renewable sources by 2026, we need to double the speed we are adding RPS eligible renewables to our power mix, from 4.3% per year to 8.7% per year.
—Stafford Nichols, Research Manager at Beacon Economics
Additionally, new industrial-scale solar and wind projects are having a hard time connecting to the grid because many transmission lines are already at capacity or do not connect to remote renewable power installations. The typical project built in 2022 took five years from the interconnection request to commercial operation, compared to three years in 2015 and less than two years in 2008.
California has been the leader in US rooftop solar for decades, but recent changes at the CPUC related to compensation for solar generation has significantly reduced the installation of residential panels. The state has 1.8 million installations capable of generating a total of more than 15 gigawatts (GW) at peak capacity, but the utilities have seen a 66% to 83% drop in residential rooftop-solar interconnection applications in the five months after the new rules went into effect in April 2023. Comparatively, utility-scale solar capacity in California was roughly 18.2 GW at the end of 2021.
Other key findings:
- Total GHG emissions in California increased by 3.4% from 2020 to 2021, which was still 5.7% lower than the pre-pandemic level in 2019.
- There has been a notable decline in the consumption of non-electricity natural gas, which has decreased by 3.4% from 2016 to 2021—this decline has been largely offset by increased adoption of renewable energy.
- Natural gas non-electricity consumption in California was still 24.4% higher than electricity consumption in 2021 and fossil fuels make up the majority of energy consumed in California, accounting for 69.2%.
- California’s cement plants account for two percent of total statewide carbon emissions and almost 10 percent of industrial emissions.
- Although California’s cement plants are marginally more emissions-efficient on a perton basis than the average American plant, they emit more CO2e per ton of cement than plants in the rest of the world. For example, they emit about 33% more than plants in China and India. Rapid adoption of alternate processes and technologies to make the manufacturing of cement less carbon-intensive could reduce emissions from cement in California by up to 24% by 2035 compared to business-as-usual.
Source from Green Car Congress
Disclaimer: The information set forth above is provided by greencarcongress.com independently of Alibaba.com. Alibaba.com makes no representation and warranties as to the quality and reliability of the seller and products.